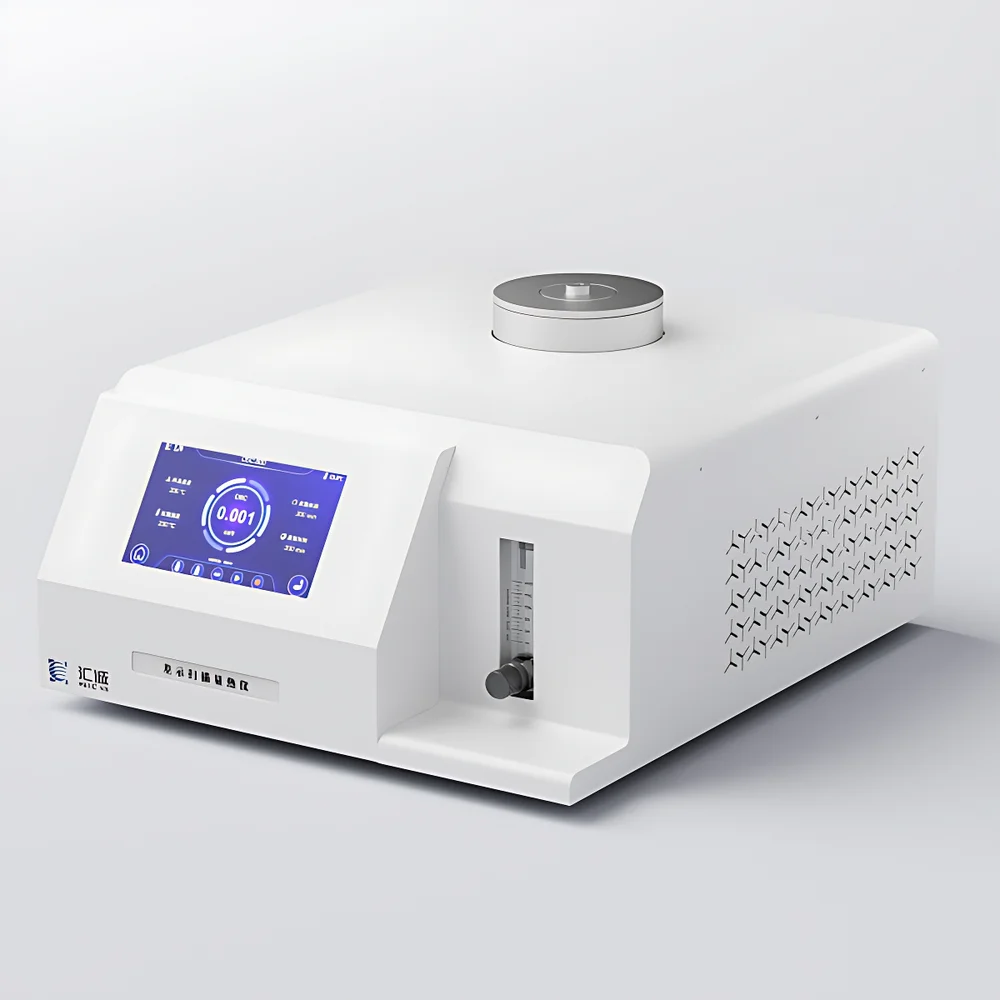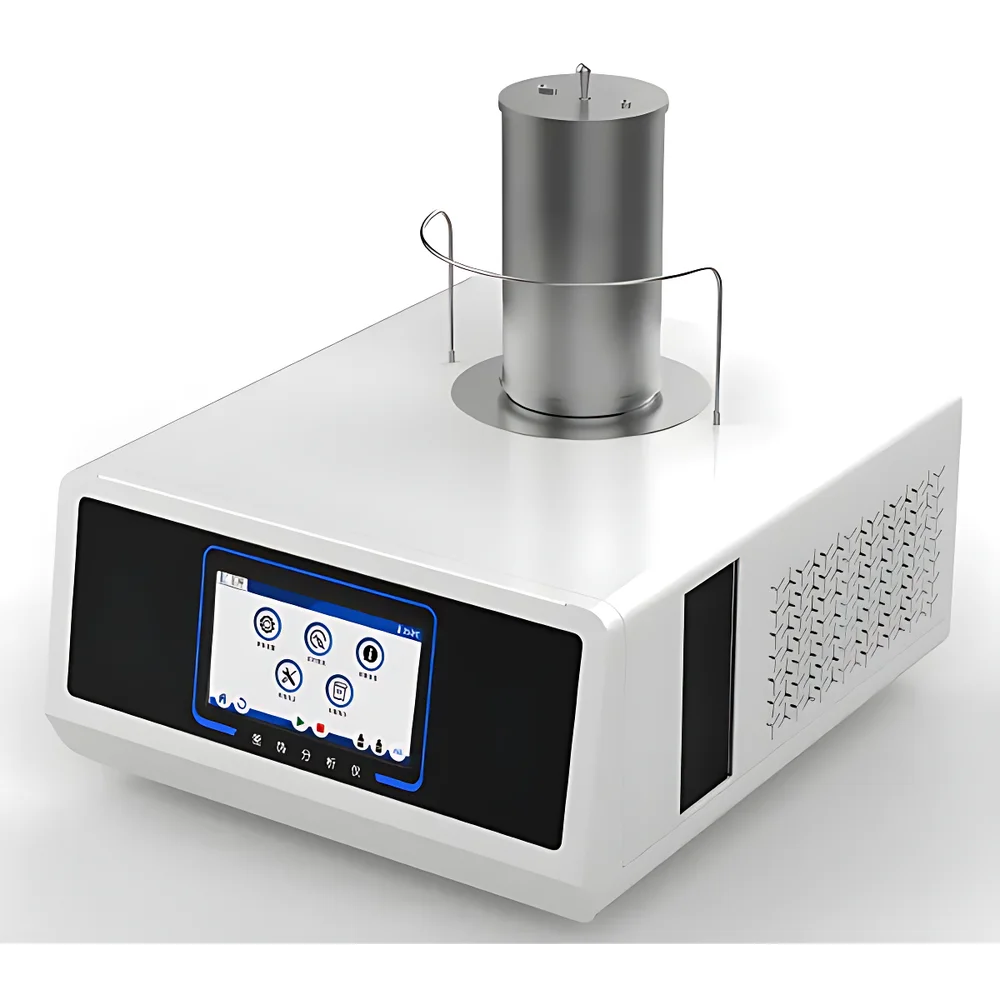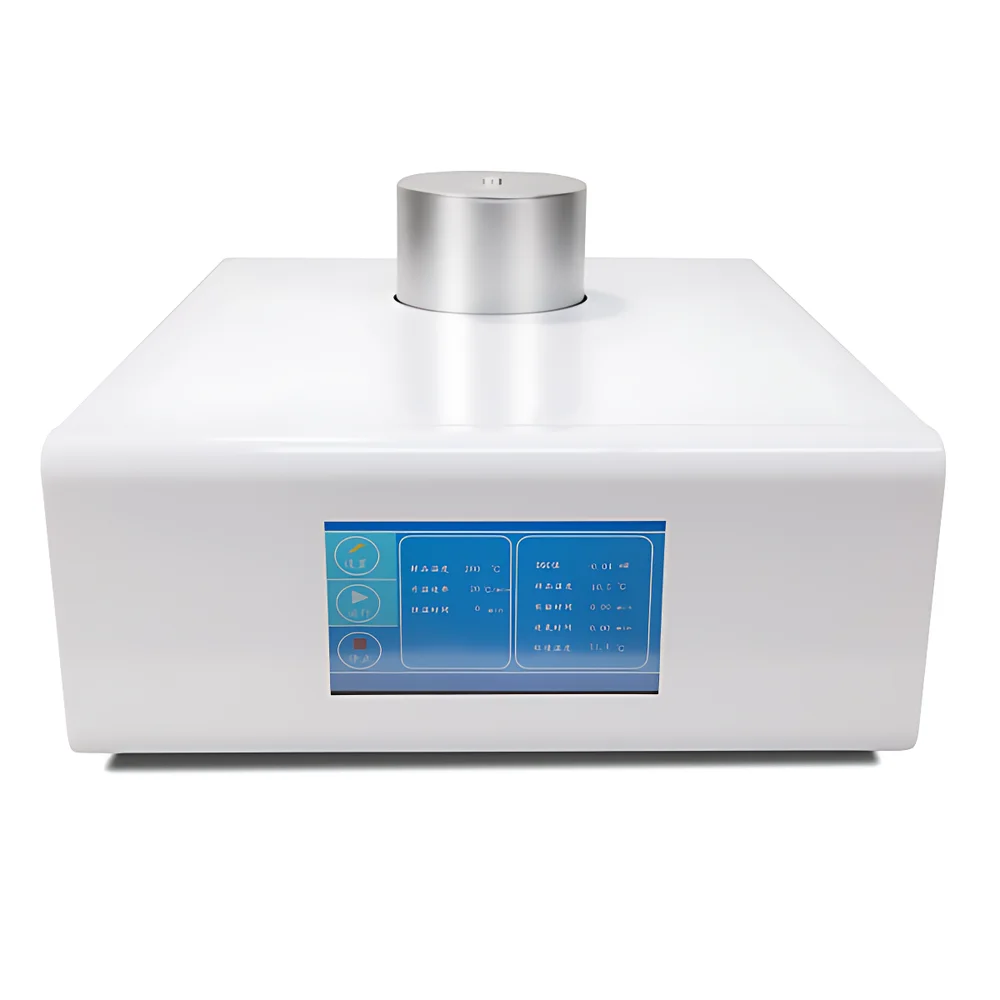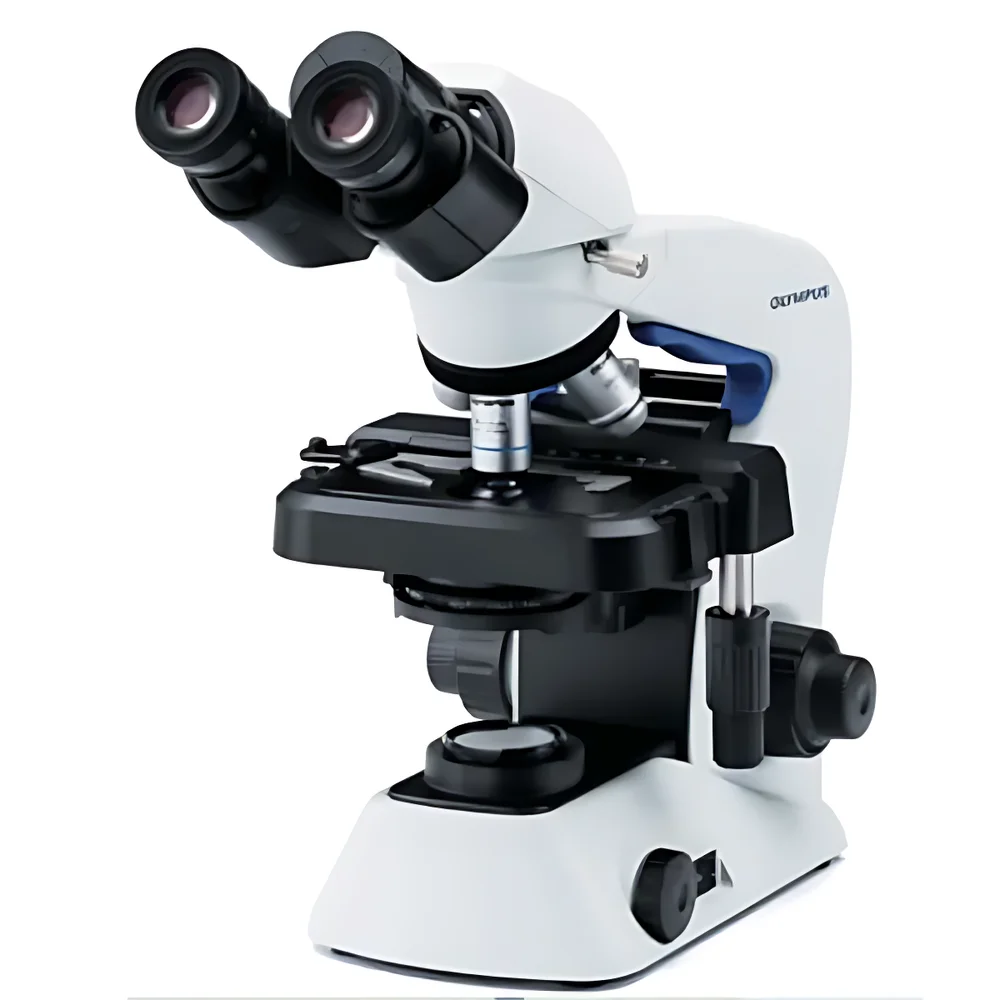
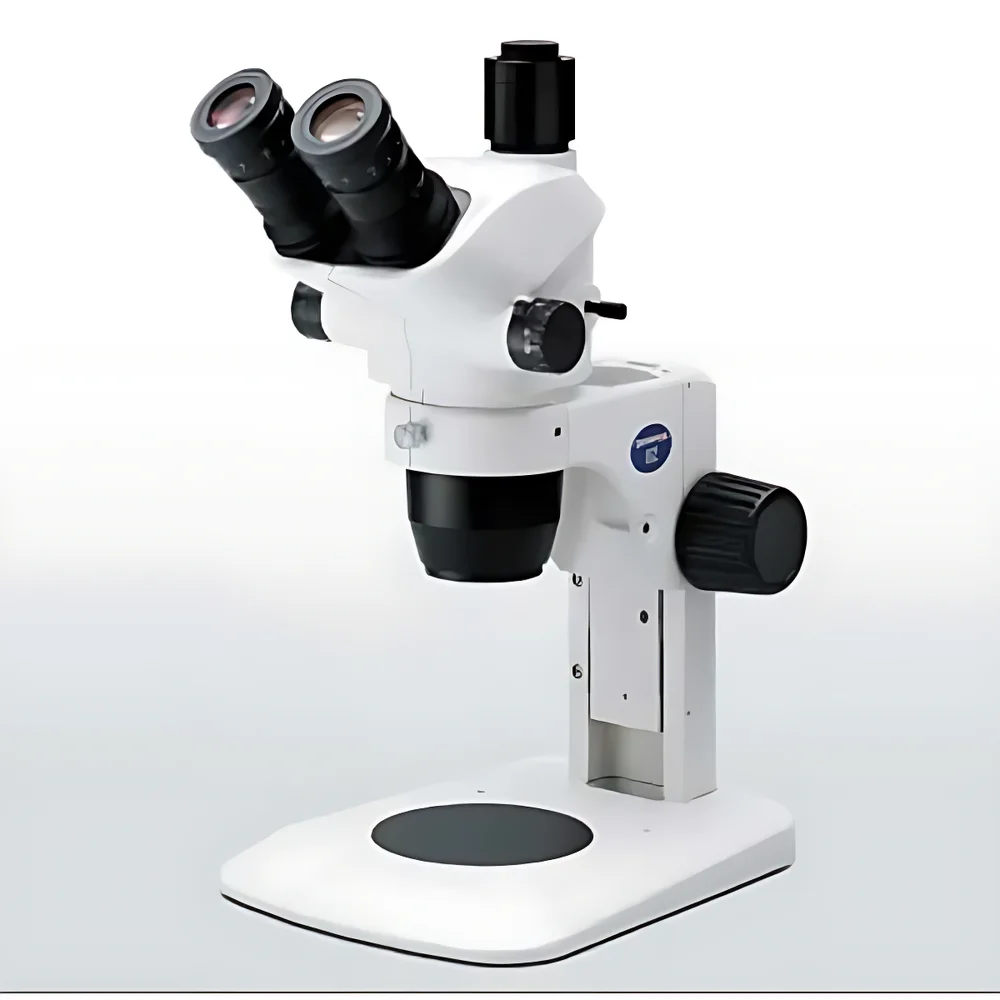
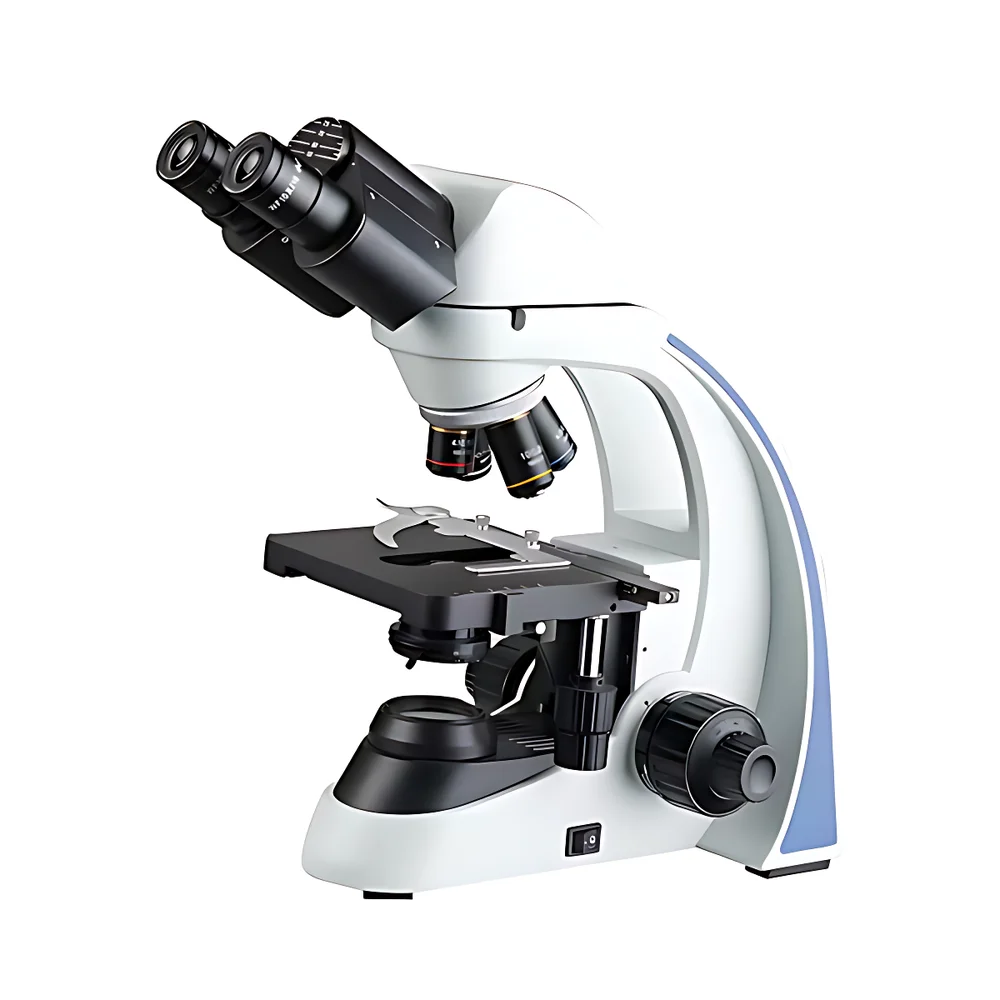
Huicheng Instrument HC3900 Carbon Black Dispersion Analyzer

| Brand | Huicheng Instrument |
|---|---|
| Origin | Jiangsu, China |
| Manufacturer Type | Manufacturer |
| Origin Category | Domestic |
| Model | HC3900 |
| Price | USD 5,000 (approx.) |
| Detection Range | 1 µm – 10 mm |
| Imaging Resolution | 2592 × 1944 (5 MP) |
| Optical Magnification | 100× |
| Adjustable Illumination Angle | Yes |
| Image Size Options | 640×480, 1024×768, 2048×1536, 2592×1944 |
| Power Supply | 220 V / 2 A / 50 Hz |
Ask about pricing, availability and specifications.
Overview
The Huicheng Instrument HC3900 Carbon Black Dispersion Analyzer is a dedicated image-based metrology system engineered for quantitative assessment of carbon black dispersion in vulcanized rubber compounds. It operates on the principle of high-resolution optical microscopy coupled with standardized digital image analysis, conforming rigorously to GB/T 6030–2006 — the Chinese national standard equivalent to ISO 11345 and aligned with ASTM D7721 practices for evaluating filler dispersion in elastomers. The instrument captures microstructural features—including agglomerate size distribution, shape factor (circularity, aspect ratio), spatial density, and cluster morphology—within polished rubber cross-sections. These morphological parameters are statistically correlated with bulk material performance metrics such as tensile strength, tear resistance, electrical resistivity, and dynamic fatigue life. Unlike subjective visual grading methods, the HC3900 delivers traceable, operator-independent quantification, enabling process validation, batch release testing, and R&D benchmarking across rubber formulation development cycles.
Key Features
- Fully automated image segmentation using adaptive thresholding and edge-detection algorithms, supporting both global and region-of-interest (ROI) analysis modes
- Calibration-integrated measurement engine with adjustable micrometer scale overlay and pixel-to-µm conversion via certified stage graticule
- Multi-resolution imaging capability: selectable output formats from VGA (640×480) up to 5-megapixel (2592×1944) for optimal signal-to-noise balance across dispersion scales
- Comprehensive morphometric output: particle count, equivalent circular diameter (ECD), projected area, Feret diameter, convex hull perimeter, and solidity index
- Pre-loaded reference image library compliant with ISO-standardized dispersion grades (Grade 1–9), plus user-definable custom libraries for proprietary compound benchmarks
- Real-time grayscale histogram generation and cumulative particle size distribution (PSD) plots with log-normal or Rosin-Rammler fitting options
- USB 2.0 interface compatible with third-party CMOS/CCD cameras and industrial-grade microscopes beyond the included optical platform
- Native support for Windows XP, 7, and 10 (32-/64-bit); no runtime dependencies or cloud activation required
Sample Compatibility & Compliance
The HC3900 is validated for use with cured rubber specimens prepared according to GB/T 6030–2006 section 5 — including cryo-microtomed or razor-blade-cut cross-sections mounted on standard glass slides and immersion-lensed with cedarwood oil (refractive index ~1.52). It accommodates samples containing N110–N990 grade carbon blacks, silica-reinforced compounds, and hybrid filler systems. All analytical outputs comply with GLP documentation requirements: audit trails record operator ID, timestamp, calibration status, image acquisition settings, and software version. Raw images and processed data files retain embedded EXIF metadata for full traceability. While not FDA 21 CFR Part 11-certified out-of-the-box, the software architecture supports integration with validated LIMS environments through CSV/Excel export and configurable report templates (PDF, PNG, TIFF).
Software & Data Management
The HC3900 Analysis Suite provides deterministic, non-proprietary data handling: all measurements are stored in open-format SQLite databases with schema documentation available upon request. Batch processing enables sequential analysis of up to 99 images with uniform parameter presets. Export functions include tab-delimited text (for statistical packages), Excel (.xlsx) with embedded charts, and publication-ready PDF reports containing annotated original micrographs, grayscale profiles, PSD curves, and summary statistics. The software logs every user action—including manual corrections to segmentation masks—and preserves intermediate processing steps for method verification. No telemetry, cloud sync, or external API calls are performed; all computation occurs locally without internet dependency.
Applications
- Quality control of production batches against dispersion specification limits (e.g., max agglomerate diameter ≤ 5 µm at ≥95% population)
- Correlation studies linking dispersion homogeneity to Payne effect magnitude in dynamic mechanical analysis (DMA)
- Optimization of mixing protocols (rotor speed, temperature, time) by tracking dispersion evolution across mixing stages
- Failure analysis of cracked or bloomed rubber components where poor filler distribution contributes to premature fatigue
- Validation of silane coupling agent efficacy in silica-filled tread compounds
- Supporting ISO/IEC 17025-accredited testing laboratories requiring documented uncertainty budgets for dispersion grading
FAQ
Does the HC3900 meet international standards beyond GB/T 6030–2006?
Yes — its measurement methodology is technically equivalent to ISO 11345 Annex B and ASTM D7721 Section 7 for digital image analysis of filler dispersion. Validation reports mapping HC3900 outputs to ISO Grade equivalency are available upon request.
Can the system analyze non-rubber elastomers such as TPU or silicone?
It can be applied to any translucent or semi-translucent polymer matrix provided sample preparation yields optically suitable sections (e.g., cryo-ultramicrotomy for thermoplastic elastomers). Contrast enhancement protocols may be required for low-refractive-index matrices.
Is hardware calibration traceable to national metrology institutes?
The supplied stage micrometer is NIST-traceable (certification included). Pixel calibration is performed per ASTM E1558 using this reference standard; calibration certificates are generated and archived with each test session.
What is the minimum detectable agglomerate size under optimal conditions?
At 100× magnification with 2592×1944 capture and optimal contrast, the practical resolution limit is ~0.8 µm (Rayleigh criterion), consistent with ISO 9276-1 definitions for particle sizing instrumentation.
Does the software support multi-user permission levels?
Not natively — the standalone application uses local Windows user accounts for file access control. For enterprise deployment, integration with domain-authenticated network shares and SQL Server backends is supported via custom configuration.