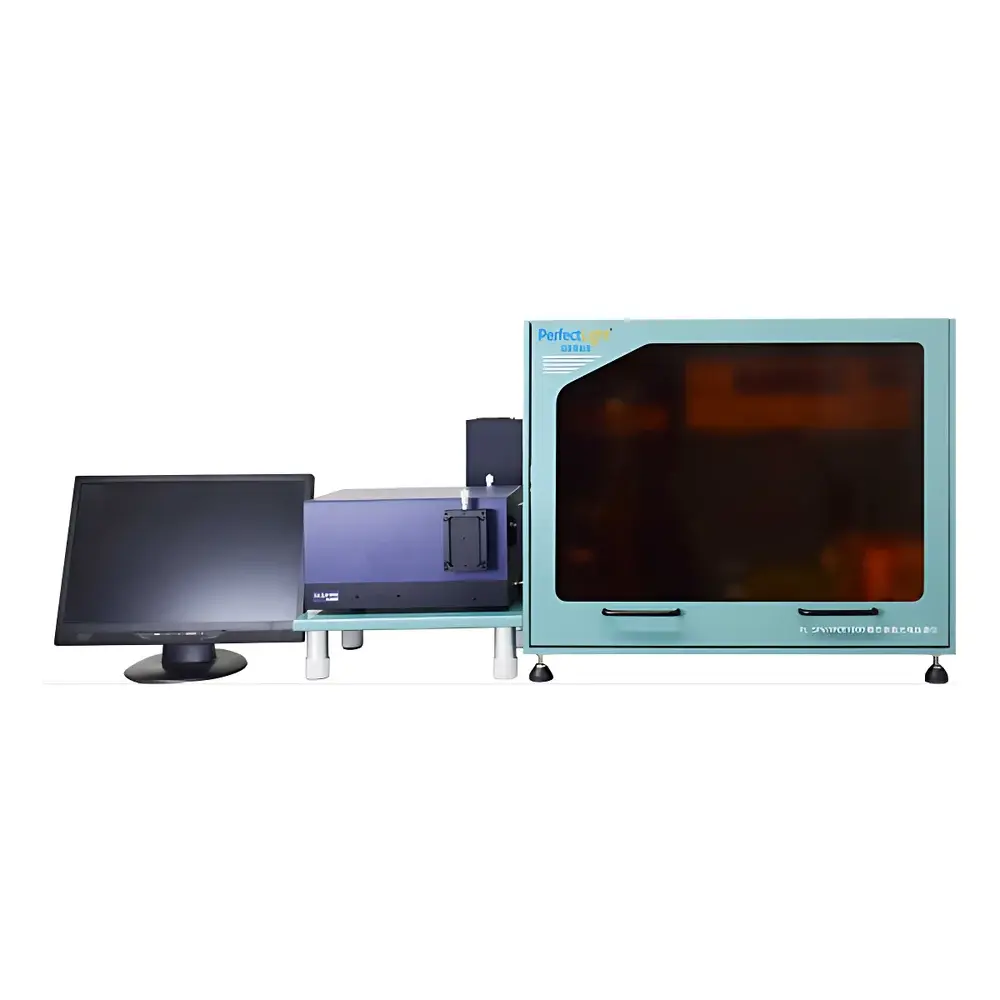

PerfectLight PL-SPV/IPCE1000 Steady-State Surface Photovoltage Spectrometer
| Brand | PerfectLight |
|---|---|
| Model | PL-SPV/IPCE1000 |
| Measurement Principle | Steady-state surface photovoltage (SPV) and incident photon-to-current efficiency (IPCE) spectroscopy |
| Wavelength Range | 300–1000 nm |
| Spectral Resolution | 2 nm |
| Minimum Detectable Photovoltage | >100 nV |
| Minimum Detectable Photocurrent | >100 pA |
| Phase Detection Range | ±180° |
| Optical Configuration | Monochromator-coupled lock-in detection with reference photodiode calibration |
Overview
The PerfectLight PL-SPV/IPCE1000 is a benchtop steady-state surface photovoltage (SPV) and incident photon-to-current efficiency (IPCE) spectrometer engineered for quantitative, non-contact characterization of photoinduced charge dynamics at material surfaces. Unlike transient techniques requiring ultrafast lasers or time-resolved electronics, the PL-SPV/IPCE1000 operates under continuous-wave illumination and employs synchronous lock-in detection to extract weak DC and AC photovoltage/photocurrent signals—enabling robust measurement of surface band bending, charge separation directionality, interfacial recombination kinetics, and spectral quantum yield without sample destruction or electrical contacting. Its optical architecture integrates a high-stability xenon or halogen light source, a Czerny-Turner monochromator with 2 nm spectral resolution, precision motorized wavelength scanning, and dual-channel lock-in amplification referenced to a calibrated photodiode. Designed for integration into standard optical tables, the system supports vacuum-compatible sample stages and optional environmental control (e.g., gas purging, temperature regulation), making it suitable for in situ and operando studies of semiconductor interfaces under realistic reaction conditions.
Key Features
- Steady-state SPV mode: Measures surface photovoltage magnitude and polarity across 300–1000 nm with sensitivity down to 100 nV, directly correlating spectral response with energy-band alignment and defect states.
- IPCE mapping capability: Computes wavelength-resolved external quantum efficiency (EQE) via synchronized photocurrent measurement relative to absolute photon flux, traceable to NIST-calibrated reference diodes.
- Dual-mode phase-resolved detection: Captures photovoltage/photocurrent phase lag relative to modulated excitation, enabling extraction of carrier lifetime components in the microsecond-to-second range through frequency-domain analysis.
- Modular optical path design: Compatible with reflective and transmissive sample geometries; accommodates conductive, semiconducting, and insulating thin films, powders, and single crystals on conductive or insulating substrates.
- Pre-aligned optical train: Minimizes alignment drift; includes automated wavelength calibration using mercury-argon emission lines and real-time intensity normalization.
Sample Compatibility & Compliance
The PL-SPV/IPCE1000 supports diverse photoactive materials including metal oxides (TiO₂, ZnO, BiVO₄), perovskites (MAPbI₃, CsPbBr₃), organic semiconductors (P3HT, PTB7), covalent organic frameworks (COFs), and plasmonic nanostructures. Sample mounting follows ASTM E2627–20 guidelines for optical characterization of thin-film photovoltaic materials. Data acquisition complies with GLP principles: all measurements include timestamped metadata (wavelength, intensity, modulation frequency, lock-in time constant, ambient temperature/humidity), and raw signal files are stored in HDF5 format with embedded instrument configuration. Optional software modules support 21 CFR Part 11-compliant audit trails, electronic signatures, and user-access-level controls for regulated environments.
Software & Data Management
The included PerfectLight SPV-Analyzer v4.x software provides full instrument control, real-time signal visualization, batch spectral acquisition, and automated IPCE calculation per IEC 60904-8 and JIS C 8912 standards. It enables multi-parameter fitting of SPV spectra using built-in Poisson–Schottky models, comparative overlay of up to 16 spectra with statistical confidence intervals, and export to MATLAB, Origin, or Python-compatible formats (CSV, HDF5, JSON). All datasets retain provenance information—including source lamp spectrum, grating position error correction, and dark-signal subtraction logs—for reproducibility auditing. Raw data files are immutable; processed results are tagged with version-controlled analysis scripts.
Applications
- Quantitative evaluation of surface band bending in photocatalysts for water splitting and CO₂ reduction.
- Correlation of SPV sign inversion with heterojunction type (Type-II vs. Z-scheme) in composite photocatalysts.
- IPCE validation of lab-scale perovskite solar cells against certified reference cells (e.g., NREL A1001).
- Discrimination of bulk versus surface recombination pathways via phase-resolved SPV under variable modulation frequencies.
- In situ monitoring of surface state passivation during atomic layer deposition (ALD) of Al₂O₃ on Si nanowires.
- High-throughput screening of dye-sensitized solar cell (DSSC) electrolyte formulations via SPV amplitude decay kinetics.
FAQ
What is the fundamental difference between steady-state SPV and transient SPV?
Steady-state SPV measures the equilibrium surface potential shift under continuous illumination, reflecting thermodynamic band alignment and slow recombination processes; transient SPV resolves sub-nanosecond to microsecond carrier trapping/detrapping kinetics using pulsed excitation.
Can the PL-SPV/IPCE1000 measure buried interfaces, such as in planar heterojunction solar cells?
Yes—when combined with front- versus back-side illumination configurations and appropriate substrate transparency, it probes interface-specific SPV signatures via field-effect modulation of surface band bending.
Is calibration traceable to national metrology institutes?
Photodiode-based spectral irradiance calibration is traceable to NIST SRM 2069 (silicon photodiode) and NIST SRM 2036 (spectral irradiance scale), with uncertainty budgets documented in the instrument’s calibration certificate.
Does the system support electrochemical biasing during SPV measurement?
Yes—the optional potentiostat interface enables simultaneous application of DC bias (±10 V) and AC perturbation (10 mHz–10 kHz) while acquiring phase-resolved SPV, facilitating Mott–Schottky and flat-band potential analysis.
How is stray light managed in the 300–400 nm UV region?
The monochromator incorporates order-sorting filters and a double-grating configuration; UV-grade fused silica optics and black anodized internal baffling reduce stray light to <1×10⁻⁵ of peak intensity below 400 nm.