AgriPheno PhenoWatch Series Greenhouse-to-Field High-Throughput Plant Phenotyping System
| Brand | AgriPheno |
|---|---|
| Origin | Shanghai, China |
| Model | PhenoWatch |
| Type | Modular Mobile 3D Phenotyping Platform |
| Imaging Modalities | LiDAR + Hyperspectral + Thermal IR + Multispectral + RGB |
| Axes Control | X-Y-Z Automated Positioning |
| Compliance | Designed for GLP-aligned phenotypic data acquisition in agronomic and genetic research |
Overview
The AgriPheno PhenoWatch Series is a modular, mobile high-throughput plant phenotyping system engineered for seamless operation across greenhouse, growth chamber, and open-field environments. Built upon the “Sensor-to-Plant” principle, it integrates synchronized multi-modal imaging—time-of-flight LiDAR, push-broom hyperspectral imaging (400–1000 nm), uncooled vanadium oxide (VoX) thermal infrared imaging (640 × 480 px), five-band multispectral imaging (Blue, Green, Red, Red Edge, NIR), and high-resolution RGB imaging—into a unified 3D spatial–spectral data acquisition architecture. Each scan generates georeferenced point clouds fused with spectral radiance values and thermal emissivity maps, enabling quantitative reconstruction of plant architecture, canopy biophysics, and physiological status at both population and individual-plant levels. The system operates under controlled motion trajectories defined in Cartesian coordinates (X: gantry translation, Y: cross-beam traverse, Z: vertical sensor elevation), ensuring repeatable, traceable, and audit-ready data collection suitable for longitudinal genotype–phenotype association studies.
Key Features
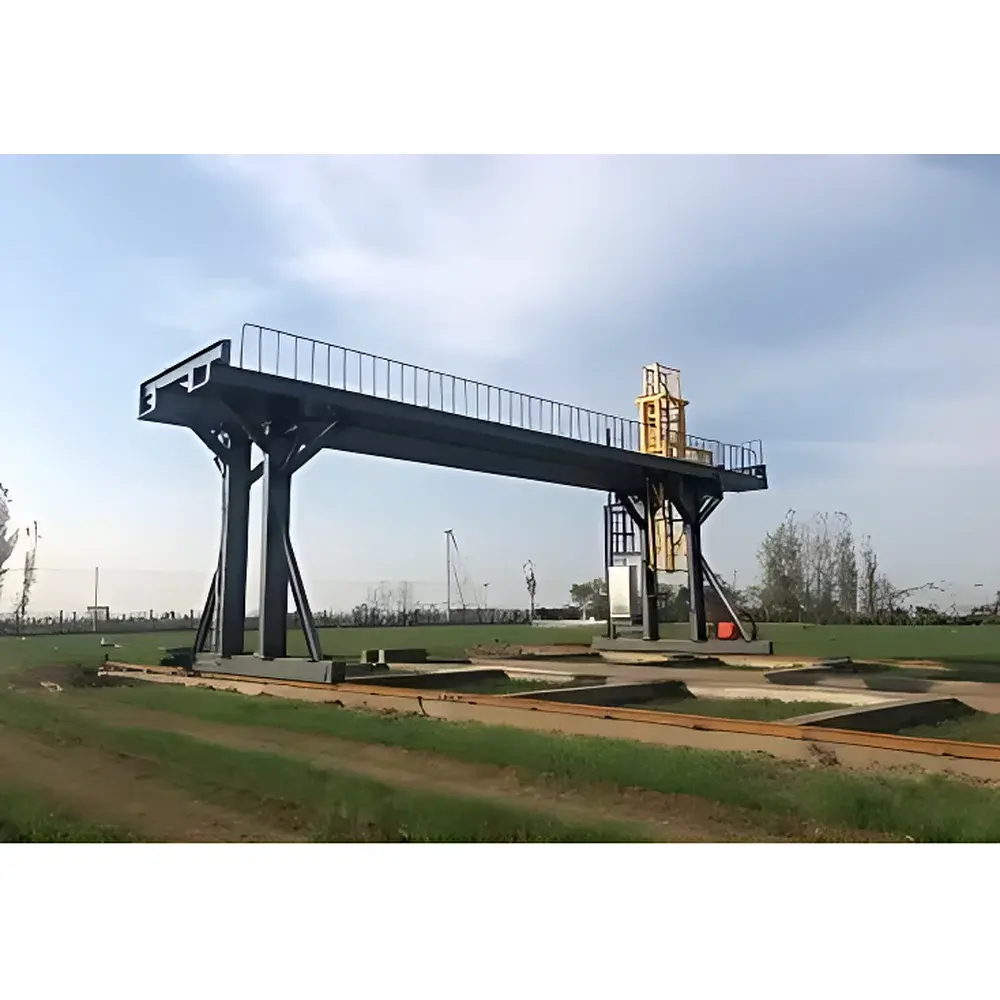
- Modular sensor integration: Interchangeable imaging modules allow configuration-specific deployment—PhenoWatch-GF (field-scale gantry), PhenoWatch-GH (greenhouse overhead rail), PhenoWatch-MB (mobile bench or multi-bay greenhouse), and PhenoWatch-MB Field Edition (off-grid mobile platform).
- LiDAR-based 3D morphometrics: Dual-axis tilt-compensated time-of-flight scanner with integrated height sensor and angular encoder enables sub-centimeter spatial accuracy (<2 cm RMS) over distances up to 15 m; supports DSM, CHM, and DEM derivation.
- Thermal infrared quantification: Uncooled VoX microbolometer (NETD ≤ 50 mK) with motorized focus, calibrated emissivity correction, and atmospheric compensation parameters (ambient temperature, relative humidity, optical path length) embedded in metadata.
- Hyperspectral analytics: Push-broom VNIR spectrometer (3–5 nm FWHM resolution) delivers pixel-wise reflectance spectra for chemometric modeling—including chlorophyll content estimation, water stress indices (NDWI, PRI), and disease lesion segmentation (e.g., Septoria tritici blotch in wheat).
- Multispectral–point cloud fusion: Five-channel spectral bands co-registered with LiDAR point clouds enable voxel-level vegetation index computation (3D NDVI, 3D TVI, 3D RVI) and spatially explicit canopy transmittance profiling.
- GPU-accelerated software pipeline: Parallelized point cloud processing leveraging CUDA-enabled NVIDIA GPUs reduces per-scan processing time by >60% compared to CPU-only workflows.
Sample Compatibility & Compliance
PhenoWatch accommodates a broad range of plant types—from Arabidopsis thaliana rosettes and rice tillers to maize canopies and mature tomato vines—across growth stages from seedling emergence through senescence. The system supports standard pot sizes (7–30 cm diameter), hydroponic trays, field plots (up to 2 m × 2 m per scan zone), and vertical farming racks. All raw data (point clouds, radiance cubes, thermal matrices, RGB images) are stored in vendor-neutral formats (LAS/LAZ, HDF5, TIFF, NetCDF) compliant with FAIR principles. Metadata adhere to ISA-Tab and MIAPPE v1.1 standards. Software audit trails meet GLP requirements for traceability, including timestamped operator logs, calibration event records, and version-controlled algorithm parameters. While not FDA-cleared, the system’s architecture aligns with 21 CFR Part 11 expectations for electronic records and signatures when deployed in regulated breeding programs.
Software & Data Management
PhenoWatch Software v4.x is a dedicated phenomics analysis suite featuring deep learning–enhanced segmentation and geometric reconstruction. It implements two complementary stem–leaf separation algorithms: (1) region-growing–based surface partitioning for low-noise, high-contrast scans; and (2) 3D U-Net–trained voxel classification for complex architectures under variable lighting. Single-plant detection employs Faster R-CNN trained on annotated field datasets (maize, sorghum, soybean), achieving >92% precision in root-zone localization. Derived metrics—including plant height, projected leaf area, leaf inclination angle distribution, canopy volume, and normalized difference vegetation index (NDVI) gradients—are exported as CSV/Excel reports with statistical summaries (mean, SD, CV%, min/max). Custom module development (e.g., stomatal conductance proxy models, drought-response trajectory clustering) is available under NDA-supported service agreements.
Applications
- Quantitative trait locus (QTL) mapping: High-reproducibility temporal phenotyping across RIL or MAGIC populations under controlled abiotic stress (drought, heat, salinity).
- Canopy light interception modeling: CHM-derived transmittance profiles used to parameterize radiative transfer simulations (e.g., SAIL, 3D Radiosity).
- Disease progression monitoring: Hyperspectral anomaly detection combined with thermal heterogeneity mapping for early identification of fungal/bacterial lesions prior to visible symptom onset.
- Biomass estimation and harvest index prediction: Regression models trained on 3D volume–dry weight correlations validated against destructive sampling across species.
- Controlled-environment phenotyping: Integration with climate-controlled greenhouses for diurnal cycle analysis of stomatal conductance proxies (via canopy temperature depression) and circadian leaf movement patterns.
- Pre-breeding screening: Rapid throughput (≤90 s per 1 m² plot) enables evaluation of thousands of lines per season in yield trials and hybrid performance testing.
FAQ
What environmental conditions affect LiDAR accuracy during field deployment?
Ambient sunlight saturation, heavy rain, and dense fog degrade signal-to-noise ratio in time-of-flight scanning. Optimal operation occurs under diffuse lighting (cloud cover ≥70%) or at dawn/dusk; real-time tilt compensation maintains registration fidelity up to ±5° ground slope.
Can PhenoWatch data be imported into third-party platforms such as Crop3D or PlantCV?
Yes—LAS/LAZ point clouds, GeoTIFF orthomosaics, and HDF5 spectral cubes are natively supported. API documentation and Python SDK are provided for programmatic access to preprocessing pipelines.
Is on-site calibration required before each measurement campaign?
A full geometric calibration (LiDAR–camera–thermal alignment) is performed annually or after hardware relocation. Daily verification uses NIST-traceable ceramic reference targets placed within the scan volume.
How does the system handle occlusion in dense canopies?
Multi-angle scanning (enabled via programmable Y/Z axis repositioning) captures partial views from ≥3 perspectives per plant; occluded regions are reconstructed using iterative closest point (ICP) fusion and convex hull interpolation.
Does PhenoWatch support automated irrigation or environmental actuation integration?
While not an actuation platform, the system provides synchronized timestamped phenotypic outputs that interface with industrial IoT gateways (e.g., Modbus TCP, MQTT) for closed-loop feedback to climate control or fertigation systems.