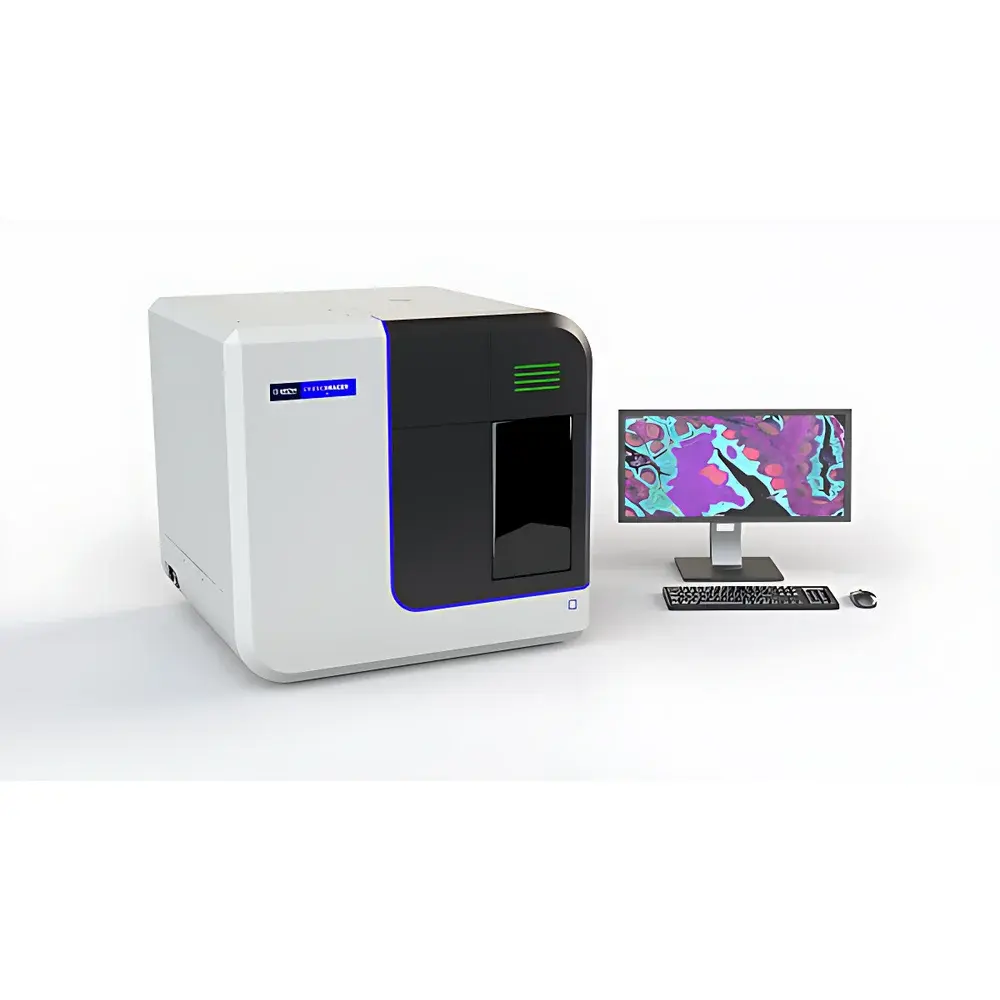
Akoya Biosciences PhenoImager HT Automated Quantitative Pathology Imaging System
| Brand | Akoya |
|---|---|
| Origin | USA |
| Model | PhenoImager HT |
| Imaging Modes | Brightfield & Multispectral Fluorescence |
| Max Multiplexing | 9-plex fluorescence |
| Scan Speed | ~6 minutes per full-tissue section (7-color, 20× equivalent) |
| Objective Magnifications | 10×–40× |
| Autofocus | High-sensitivity dynamic autofocus |
| Excitation | Pulsed LED-based fluorescence excitation |
| Primary Application | Spatially resolved quantitative tissue biomarker analysis |
Overview
The Akoya Biosciences PhenoImager HT is an automated, high-throughput quantitative pathology imaging system engineered for spatially resolved, multispectral fluorescence analysis of formalin-fixed paraffin-embedded (FFPE) and frozen tissue sections. Built upon a robust optical platform integrating tunable spectral detection with motorized whole-slide scanning, the system enables label-free unmixing of spectrally overlapping fluorophores without requiring sequential staining or hardware filter changes. Its core measurement principle relies on hyperspectral image acquisition—capturing a full emission spectrum (typically 450–750 nm at 2–5 nm resolution) at each pixel—followed by constrained linear unmixing against reference spectra to quantify individual biomarker signals with high specificity and reproducibility. Designed for translational research and clinical assay development labs, the PhenoImager HT delivers standardized, objective, and audit-ready digital pathology data compatible with downstream spatial biology workflows including cell phenotyping, neighborhood analysis, and tissue architecture mapping.
Key Features
- Integrated brightfield and multispectral fluorescence imaging in a single instrument platform, enabling co-registration of morphological context and multiplexed protein expression.
- Automated whole-slide scanning across 10× to 40× magnifications, with optimized throughput: a standard 15 mm × 15 mm tissue area is acquired in ≤6 minutes using a 7-color panel at 20×-equivalent resolution.
- Spectral unmixing engine calibrated against user-defined or vendor-provided reference spectra, supporting up to 9-plex fluorescent detection with minimal crosstalk and high signal-to-noise ratio.
- Dynamic autofocus system utilizing real-time contrast-based height mapping across heterogeneous tissue topographies—including folds, folds, and section thickness variations—to maintain consistent focus throughout large-area acquisitions.
- Pulsed LED excitation architecture minimizes photobleaching and thermal damage during extended exposure, preserving antigen integrity and enabling repeat imaging of the same slide over time.
- Modular hardware design compliant with standard laboratory bench footprint (W × D × H: 76 × 61 × 56 cm) and integrated UPS-ready power management for uninterrupted overnight acquisitions.
Sample Compatibility & Compliance
The PhenoImager HT accepts standard glass microscope slides (1 × 3 inches, 1 mm thickness), including charged, APES-coated, and electrostatic adhesion variants. It supports common immunofluorescence (IF) and immunohistochemistry (IHC)-based multiplex assays—including Opal™ Polymer-based tyramide signal amplification (TSA) and conventional direct-conjugated antibodies. All image acquisition parameters—including exposure time, gain, z-stack depth, and spectral binning—are stored as metadata in OME-TIFF format, ensuring traceability per ISO 15189 and CLIA-aligned quality management systems. The system’s software architecture conforms to FDA 21 CFR Part 11 requirements for electronic records and signatures when deployed with appropriate access controls and audit trail configuration.
Software & Data Management
Acquisition and analysis are managed through PhenoCode™ Software Suite v3.2+, which provides a validated, version-controlled environment for protocol creation, batch processing, and spatial quantification. Raw spectral cubes are processed using GPU-accelerated unmixing algorithms; output includes per-pixel concentration maps, segmented cell masks, and annotated region-of-interest (ROI) statistics. Quantitative outputs—such as positive cell counts per mm², percentage of stained area, mean intensity per compartment (nuclear/cytoplasmic/membranous), and H-score equivalents—are exportable in CSV, JSON, and FCS-compatible formats. Data provenance is maintained via embedded DICOM-SR structured reporting support and integration with LIMS via RESTful API endpoints. Audit logs record all user actions, parameter modifications, and reprocessing events in alignment with GLP/GMP documentation standards.
Applications
- Translational biomarker discovery: simultaneous quantification of immune checkpoint proteins (e.g., PD-1/PD-L1/CTLA-4), tumor antigens, and stromal markers within intact tissue architecture.
- Clinical trial companion diagnostics: generation of objective, continuous scoring metrics for regulatory submission packages under ICH E17 and FDA guidance on complex biomarkers.
- Tumor microenvironment (TME) characterization: spatial proximity analysis between cytotoxic T cells and malignant epithelial cells, including distance-based interaction matrices and cellular neighborhood clustering.
- Longitudinal tissue monitoring: serial imaging of archival cohorts to assess therapy-induced changes in cellular composition and spatial organization.
- Assay validation and transfer: cross-site reproducibility studies supported by standardized spectral libraries and instrument performance qualification (PQ) protocols.
FAQ
Does the PhenoImager HT require specialized training to operate?
Yes—operators must complete Akoya-certified training covering spectral calibration, reference library generation, and QC workflow execution. Remote support and annual proficiency testing are included in the service contract.
Can existing single-plex IHC/IF slides be re-analyzed on this platform?
Yes, provided slides retain sufficient fluorophore signal intensity and have not undergone prolonged ambient light exposure or mounting medium degradation.
Is the system compatible with third-party antibody panels?
Yes—the platform accepts custom conjugates and vendor-agnostic fluorophores; however, spectral reference profiles must be empirically acquired prior to unmixing.
What file formats are generated during acquisition?
Primary outputs include OME-TIFF spectral stacks, accompanied by JSON-formatted metadata, segmentation masks (GeoJSON), and summary statistics (CSV).
How is instrument performance verified over time?
Daily automated self-tests validate focus stability, LED intensity consistency, and spectral channel alignment; annual PQ includes NIST-traceable reference slide imaging and report generation.
Related Products