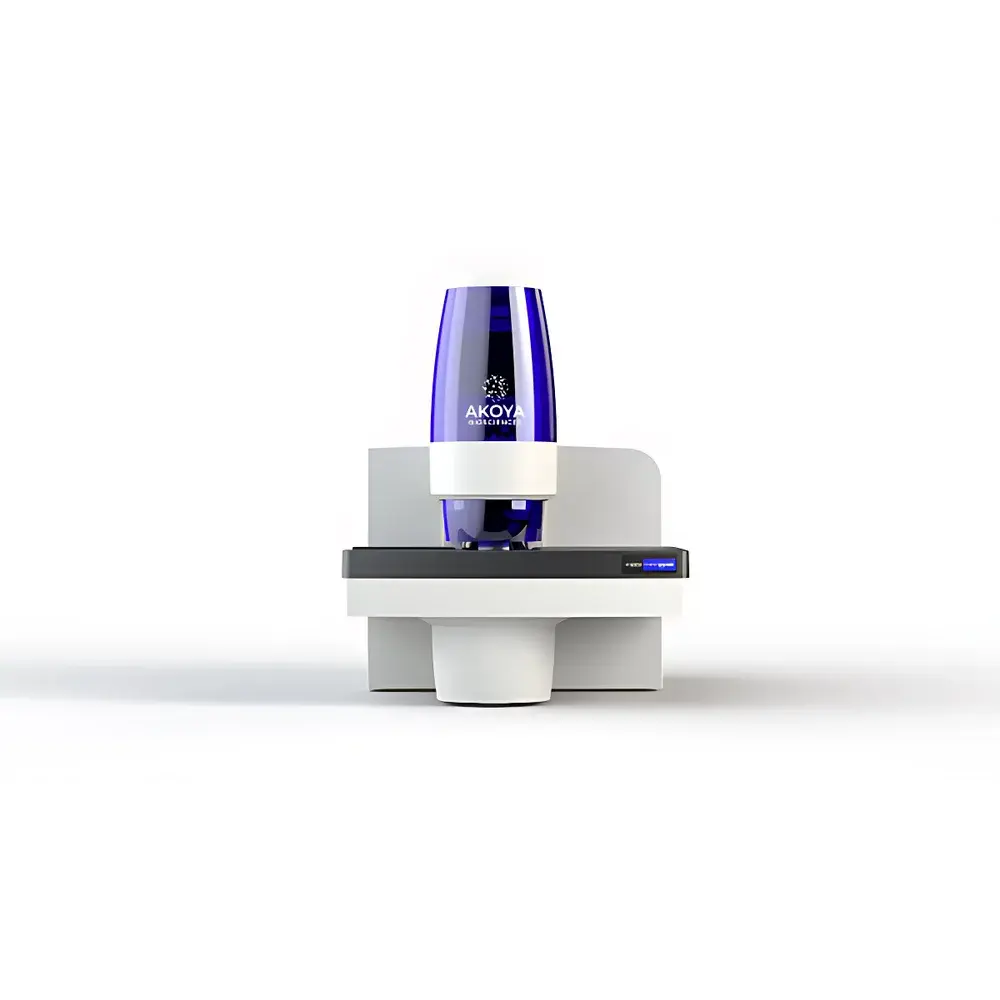
Akoya PhenoImager Fusion Multispectral Multiplex Fluorescence Quantitative Imaging System
| Brand | Akoya |
|---|---|
| Origin | USA |
| Model | PhenoImager Fusion |
| Imaging Speed | Full-slide 7-color scan in ≤18 minutes |
| Spectral Range | 440–780 nm (tunable liquid crystal filter) |
| Objective Magnifications | 10×, 20×, 40× |
| Throughput | Up to 4 slides per automated run |
| Detection Modes | Multispectral fluorescence, brightfield RGB, conventional epi-fluorescence, optical density (OD)-based quantification |
| Compatibility | PhenoCycler™ integration (≥100-plex workflows), TMA analysis, .QPTIFF output |
| Regulatory Compliance | FDA 21 CFR Part 11–compliant image storage and audit trail |
Overview
The Akoya PhenoImager Fusion is a high-performance multispectral multiplex fluorescence quantitative imaging system engineered for spatially resolved, quantitative phenotyping of intact tissue sections. Built upon a proprietary epi-fluorescence multispectral acquisition architecture, it captures full-spectrum emission data across the visible range (440–780 nm) using a tunable liquid crystal filter — enabling unmixing of spectrally overlapping fluorophores without hardware reconfiguration. Unlike conventional widefield or confocal systems limited by fixed filter sets or sequential scanning, the PhenoImager Fusion acquires complete spectral stacks in a single pass per field, preserving spatial integrity and minimizing photobleaching. Its optical design incorporates diffraction-limited precision stage positioning, non-contact coverslip detection, and OD-calibrated intensity measurement — ensuring reproducible, quantitative signal extraction across large-area tissue sections (e.g., whole-slide FFPE or frozen sections). The system serves as the imaging backbone of Akoya’s spatial biology platform, interoperating seamlessly with the PhenoCycler™ for iterative cyclic immunofluorescence (CyCIF) or DNA-oligo conjugated antibody workflows exceeding 100-plex biomarker detection.
Key Features
- Full-slide multispectral imaging at 10×, 20×, or 40× magnification with sub-micron stage repeatability and auto-focus stability
- Tunable liquid crystal filter (LCF) with programmable center wavelength and bandwidth (440–780 nm), eliminating manual filter wheel changes
- Simultaneous acquisition of up to 7 spectral channels — including DAPI, autofluorescence (AF), and six user-defined biomarkers — in ≤18 minutes per slide
- Optical density (OD)-referenced fluorescence quantification, enabling cross-slide and cross-instrument intensity normalization
- Automated 4-slide loader with integrated dust mitigation via non-contact coverslip height sensing (patent-pending)
- Native support for brightfield RGB and conventional epi-fluorescence modes — compatible with standard IHC/IF protocols without protocol redesign
- Diffraction-optimized optical path and high-quantum-efficiency sCMOS detector for low-noise, high-dynamic-range spectral capture
Sample Compatibility & Compliance
The PhenoImager Fusion accepts standard glass microscope slides (1 × 3 inches), including formalin-fixed paraffin-embedded (FFPE) sections, frozen sections, cytology preparations, and tissue microarrays (TMAs). It supports both single-round multiplex IF (up to 7-plex) and iterative cyclic workflows when paired with PhenoCycler™ instrumentation. All acquired images are stored in the vendor-neutral .QPTIFF format — an extension of TIFF compliant with OME-BigTIFF standards — embedding spectral metadata, calibration parameters, and instrument configuration logs. Image acquisition, processing, and export workflows adhere to FDA 21 CFR Part 11 requirements: electronic signatures, audit trails, role-based access control, and immutable image archives are enforced at the software layer. The system is validated for use in GLP-compliant preclinical studies and supports IQ/OQ/PQ documentation packages for GMP-aligned labs.
Software & Data Management
Imaging control, spectral unmixing, and quantitative analysis are unified within the Phenochart™ viewer and inForm® 2.7+ software suite. Phenochart provides rapid panning/zooming of multispectral whole-slide images with real-time spectral recombination and region-of-interest (ROI) annotation. inForm performs cell segmentation (nuclear + cytoplasmic/membrane), phenotype classification (based on marker co-expression thresholds), and spatial relationship mapping (e.g., nearest-neighbor distance, cellular neighborhood composition). All processing pipelines generate traceable, version-controlled reports. Exported .QPTIFF files integrate natively with Akoya’s phenoptrReports for statistical modeling and visualization, while open metadata schemas ensure compatibility with third-party platforms (e.g., QuPath, HALO, Visium Spatial Gene Expression pipelines). Data encryption, DICOM-SR export options, and PACS integration are available via optional modules.
Applications
- Spatial characterization of tumor immune microenvironments (TIME), including T-cell exhaustion markers, macrophage polarization states, and tertiary lymphoid structure (TLS) mapping
- Quantitative validation of spatial transcriptomics findings at protein level resolution
- Longitudinal biomarker assessment in clinical trial biobanks using archived FFPE cohorts
- Development of AI-ready annotated datasets for deep learning model training in digital pathology
- High-content phenotyping of organoid and 3D culture models with preserved spatial context
- Multi-omic correlation studies integrating PhenoImager-derived protein maps with PhenoCycler™-generated nucleic acid data
FAQ
Does the PhenoImager Fusion require specialized fluorophore conjugates?
No — it is compatible with standard Alexa Fluor®, Cy™, and other commercially available secondary antibodies. Spectral unmixing relies on empirical reference spectra, which can be generated in-house using single-stained controls.
Can existing inForm® licenses be migrated to the PhenoImager Fusion platform?
Yes — inForm® 2.5 and later versions support PhenoImager Fusion natively; license portability is managed through Akoya’s customer portal.
Is whole-slide scanning supported at 40× magnification?
Yes — full-spectrum acquisition is available at all supported objectives, though 40× scanning requires longer dwell time per field and is typically used for targeted ROI analysis rather than routine screening.
How is autofluorescence handled during spectral unmixing?
Autofluorescence is modeled as a distinct spectral component and explicitly unmixed alongside biomarker signals, improving specificity in challenging tissues (e.g., liver, kidney, or aged samples).
What file formats are generated during acquisition and analysis?
Raw acquisitions are saved as .QPTIFF; processed cell tables export as CSV or FCS; phenotypic maps and spatial statistics are reportable in PDF, HTML, or interactive web-based dashboards via phenoptrReports.