Attocube cryoRaman Low-Temperature High-Magnetic-Field Confocal Raman Microscope
| Brand | Attocube Systems AG |
|---|---|
| Origin | Germany |
| Manufacturer Type | Authorized Distributor |
| Instrument Type | Confocal Raman Microscope |
| Spectral Range | 400–1000 nm |
| Spectral Resolution | <1 cm⁻¹/pixel (with 1800 lines/mm grating) |
| Spatial Resolution | <400 nm (at 532 nm excitation) |
| Minimum Detectable Raman Shift | 10 cm⁻¹ |
| Spectral Reproducibility | ±0.1 cm⁻¹ (typical, after spectral calibration) |
Overview
The Attocube cryoRaman is a fully integrated low-temperature, high-magnetic-field confocal Raman microscope engineered for quantitative nanoscale spectroscopic imaging under extreme cryogenic and magnetostatic conditions. It operates on the principle of confocal micro-Raman spectroscopy—where a diffraction-limited laser spot is focused onto a sample within a cryostat or superconducting magnet, and inelastically scattered photons are collected through a high-numerical-aperture (NA) objective, spectrally dispersed via a high-throughput Czerny–Turner spectrograph, and detected with a back-illuminated, thermoelectrically cooled CCD. Unlike conventional Raman systems, the cryoRaman is co-engineered by Attocube Systems AG (for ultra-low-vibration cryogenics and sub-nanometer precision positioning) and WITec GmbH (for ultra-high-throughput spectroscopy and automated hyperspectral imaging), enabling simultaneous spatial, spectral, and temporal resolution at temperatures down to 1.8 K and magnetic fields up to 15 T.
Key Features
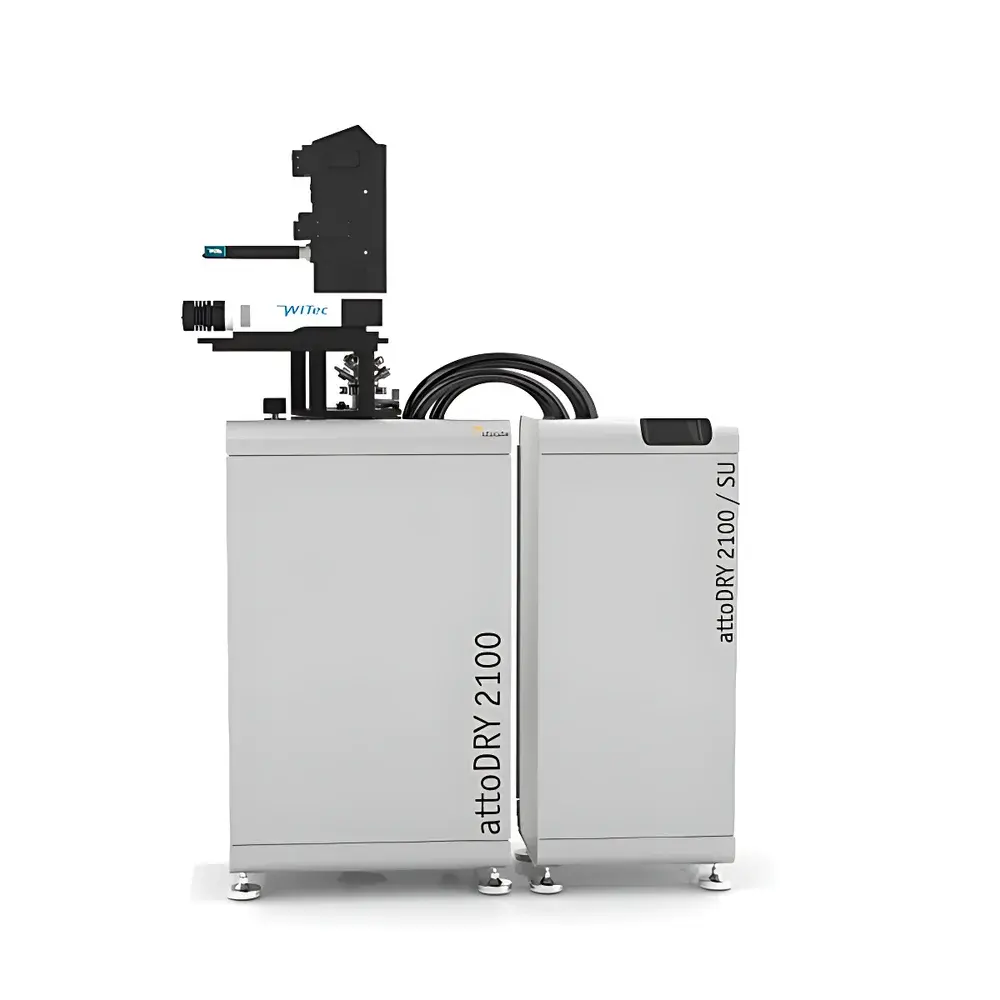
- Integrated cryogenic platform: attocube attoDRY2100 (1.8–300 K) or attoDRY800 (4–320 K), equipped with active vibration damping and thermal anchoring optimized for optical stability
- High-field magnet compatibility: supports split-pair, vertical-field, and vector-field magnets (9 T, 12 T, 9/3/1 T, 5/2/2 T configurations); field homogeneity maintained across full scanning range
- Confocal architecture with apochromatic low-temperature objectives: LT-APO/532-Raman, LT-APO/633-Raman, LT-APO/NIR (NA ≥ 0.7), corrected for chromatic and thermal aberrations at cryogenic temperatures
- Ultra-low-wave-number capability: RayShield Coupler enables rejection of Rayleigh scattering below 10 cm⁻¹, permitting access to acoustic phonons, magnons, and interlayer shear modes
- Polarization-resolved measurement module: motorized rotating polarizer/analyzer pair with crystal-axis alignment capability for anisotropic crystal characterization
- Automated XYZ coarse positioning (5 × 5 × 4.8 mm³) combined with piezo-driven scanning (50 × 50 µm² at 300 K; 30 × 30 µm² at 4 K), calibrated for thermal drift compensation
- UHTS (Ultra-High-Throughput Spectrograph): f = 300 mm, mirror-based design with automated triple-grating turret (600/1200/1800 lines/mm), BLZ-optimized for 532 nm
Sample Compatibility & Compliance
The cryoRaman accommodates standard cryogenic sample mounts (e.g., ASH/QE/8/CFM, ASH/QE/4CX) and interfaces seamlessly with vacuum-compatible optical tables, gloveboxes, and inert-atmosphere transfer systems. All optical components—including beam paths, filter wheels, and detector housings—are designed for operation under UHV (≤10⁻⁶ mbar) and cryogenic thermal cycling without misalignment. The system complies with ISO 17025 requirements for metrological traceability when used with NIST-traceable Raman shift standards (e.g., silicon, cyclohexane). Software workflows support audit trails, electronic signatures, and user-defined parameter locking per experiment—enabling compliance with GLP and FDA 21 CFR Part 11 for regulated research environments.
Software & Data Management
Data acquisition, real-time processing, and post-analysis are managed through WITec Suite FIVE—a modular, scriptable software platform built on Qt and Python APIs. Core capabilities include: synchronized stage-spectrometer control with hardware-triggered pixel-by-pixel spectral acquisition; automatic dark-current subtraction, cosmic-ray removal, and fluorescence background modeling (via polynomial or asymmetric least squares); spectral library matching using TrueMatch (optional), supporting custom database creation and multivariate analysis (PCA, cluster mapping). The suite includes built-in tools for depth profiling, 3D volumetric reconstruction, polarization tensor decomposition, and temperature-/field-dependent peak fitting (Voigt, Lorentzian, Breit–Wigner–Fano). All raw spectra and metadata (laser power, integration time, position, T, B, polarization angle) are stored in HDF5 format with embedded provenance tags.
Applications
- Quantitative phonon dispersion mapping in 2D van der Waals heterostructures (e.g., MoS₂, WSe₂, hBN) across temperature (1.8–300 K) and magnetic field (0–15 T)
- Detection of layer-number–dependent excitonic fine structure and valley polarization in transition metal dichalcogenides
- Identification of magnetic phase transitions via magnon–phonon coupling signatures in antiferromagnetic insulators (e.g., MnBi₂Te₄, CrI₃)
- Probing electron–phonon coupling strength in high-Tc cuprates and iron-based superconductors via temperature-dependent linewidth and frequency shifts
- Strain and doping mapping in graphene and carbon nanotubes using G- and 2D-band splitting, broadening, and intensity ratios
- Low-frequency interlayer shear and breathing modes in moiré superlattices (e.g., WSe₂/WS₂), resolved with RayShield-coupled detection
FAQ
What is the minimum achievable temperature and maximum magnetic field simultaneously?
The system achieves 1.8 K in the attoDRY2100 platform while operating under up to 12 T in compatible vector magnets; field and temperature limits are interdependent and specified per magnet–cryostat integration configuration.
Can the system perform simultaneous Raman and photoluminescence (PL) measurements?
Yes—via automated optical path switching between Raman edge filters and broadband PL collection optics; both modalities share identical spatial registration and thermal/magnetic environment.
Is spectral calibration traceable to international standards?
Yes—calibration uses NIST-traceable reference materials (e.g., crystalline Si at 520.7 cm⁻¹) with automated daily validation routines; calibration uncertainty is ≤ ±0.05 cm⁻¹ (k = 2).
How is laser power stabilized during long-term low-temperature experiments?
TruePower (optional upgrade) provides real-time feedback-controlled attenuation using a calibrated photodiode and motorized neutral density wheel, maintaining power stability within ±1% over 24 hours.
Does the software support batch processing of large hyperspectral datasets?
Yes—Suite FIVE includes parallelized processing pipelines for >10⁶-pixel maps, GPU-accelerated peak fitting, and export to Python/MATLAB for custom algorithm integration.


