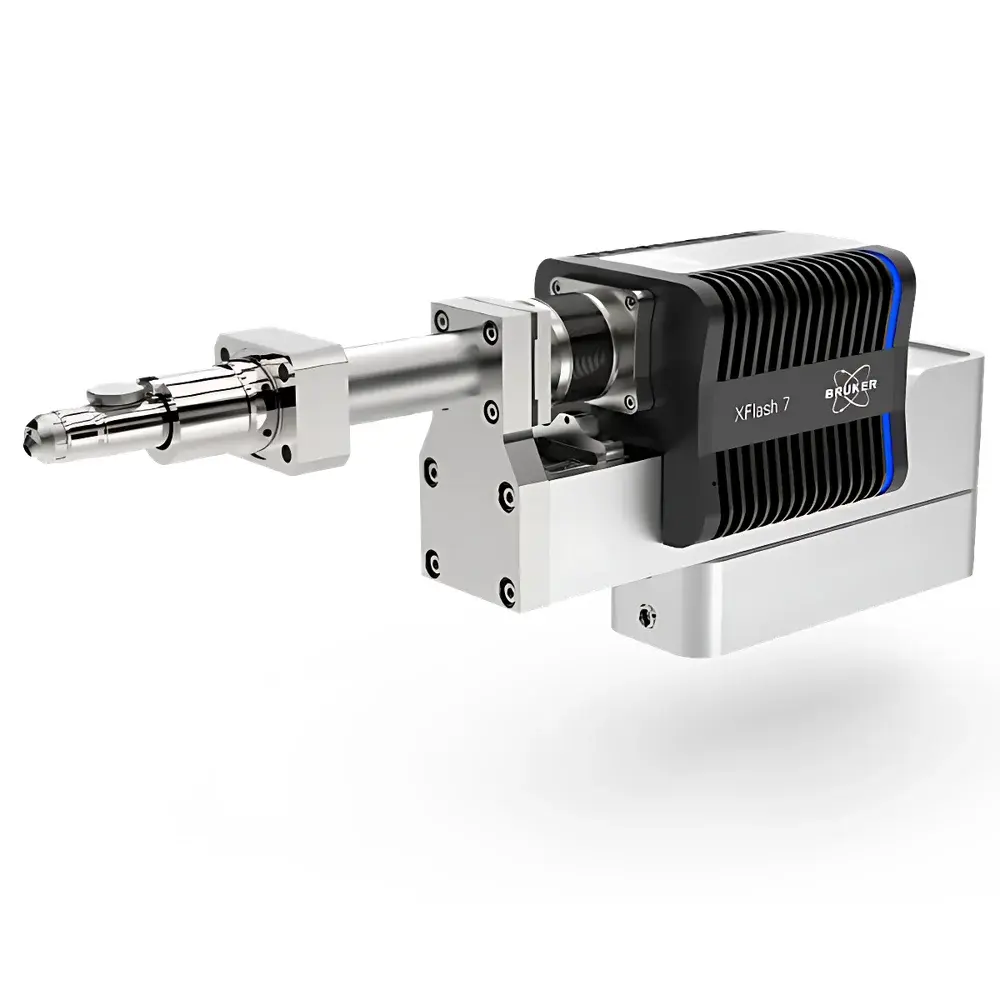
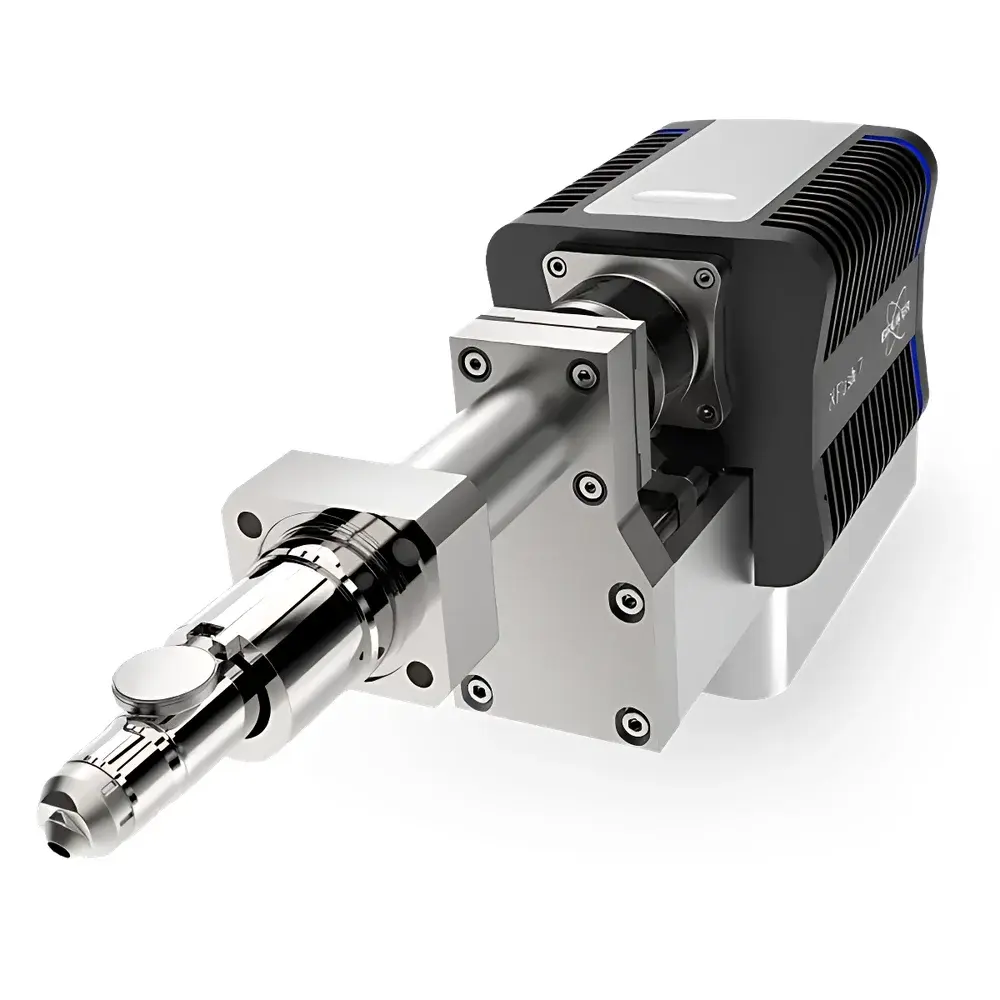
Bruker QUANTAX EDS System for TEM/STEM
| Brand | Bruker |
|---|---|
| Origin | Germany |
| Manufacturer Type | Authorized Distributor |
| Origin Category | Imported |
| Model Series | QUANTAX Transmission Electron Microscopy (TEM/STEM) EDS |
| Energy Resolution | <129 eV |
| Peak-to-Background Ratio | 20,000:1 |
| Maximum Count Rate | 1500 kcps |
| Elemental Detection Range | Be to Cf |
| Detector Active Area | 10–300 mm² |
| Window Options | Polymer Ultrathin Window or Windowless |
Overview
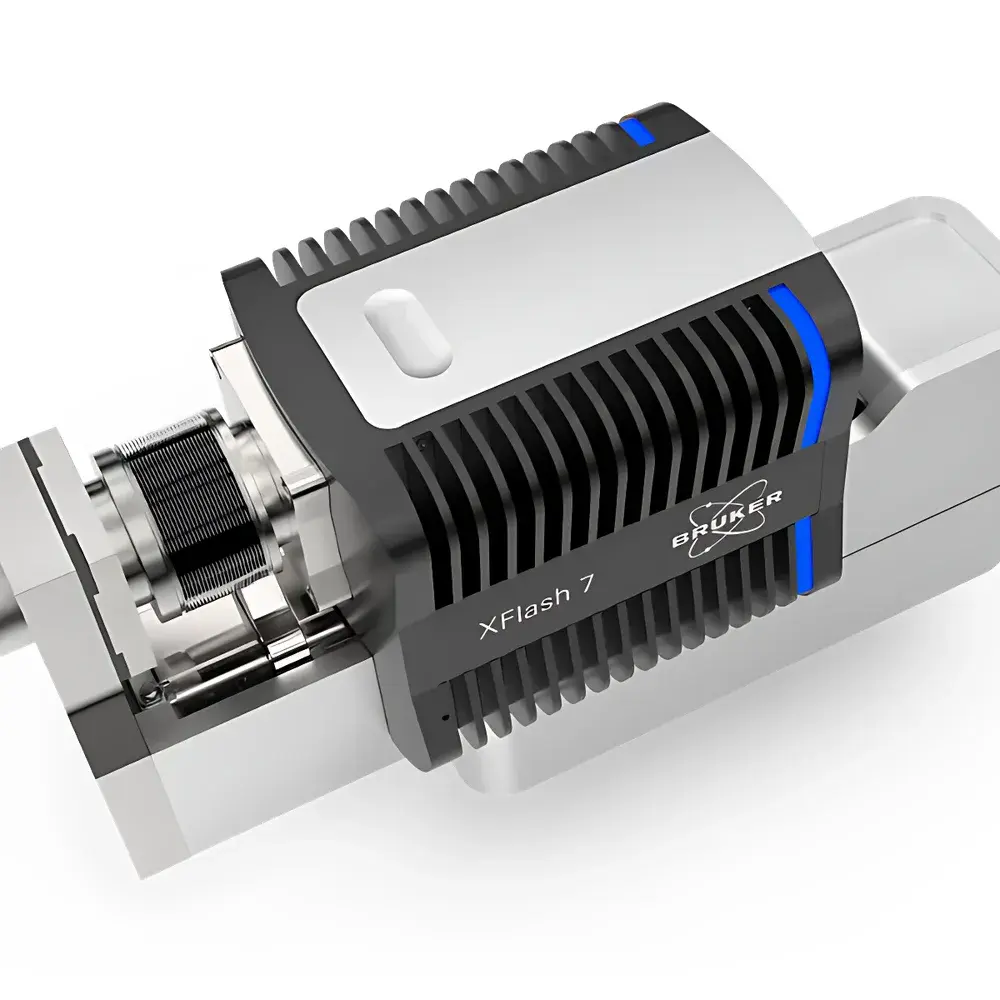
The Bruker QUANTAX EDS System for TEM/STEM is a high-performance energy dispersive X-ray spectrometer engineered for integration with transmission and scanning transmission electron microscopes. It operates on the principle of X-ray fluorescence detection following electron beam excitation, enabling simultaneous multi-elemental identification and quantification at nanometer spatial resolution. Designed specifically for the demanding constraints of TEM/STEM pole-piece geometries and EDS flange configurations, the QUANTAX TEM/STEM series features a slim-line probe architecture that maximizes solid angle of collection while minimizing shadowing and absorption artifacts. Its optimized take-off angle and compact mechanical footprint ensure compatibility across major TEM platforms—including JEOL, Thermo Fisher Scientific (FEI), and Hitachi—without compromising beam path integrity or specimen tilt capability. The system delivers high-fidelity spectral data with minimal dead time and intrinsic background contribution, supporting rigorous materials characterization in research and industrial QA/QC environments.
Key Features
- Ultra-slim probe design tailored for TEM/STEM pole-piece clearance and EDS flange alignment, ensuring optimal working distance and geometric efficiency.
- High-collection-solid-angle configuration enhances count statistics and reduces acquisition time without sacrificing spatial resolution.
- Advanced drift correction algorithm enables stable, repeatable nano-scale elemental mapping over extended acquisition periods.
- Time-resolved dynamic acquisition mode supports in situ experiments such as heating, cooling, or gas-environment studies, capturing continuous spectral data streams with timestamped metadata.
- Vibration- and magnetic-field-isolated detector housing minimizes signal noise and peak broadening, critical for high-resolution quantitative analysis.
- Windowless or ultrathin polymer window options accommodate light-element detection down to beryllium (Be), with robust contamination mitigation strategies.
- Integrated motorized probe positioning system allows precise, reproducible detector placement and rapid reconfiguration between analytical modes.
Sample Compatibility & Compliance
The QUANTAX TEM/STEM EDS system is compatible with standard TEM grid holders, cryo-stages, and in situ holders (e.g., heating, biasing, environmental cells). Its low-absorption detector geometry maintains accuracy across variable sample thicknesses and tilt angles up to ±30°. Quantitative analysis workflows adhere to ISO 14782:2022 (electron probe microanalysis – quantification procedures) and ASTM E1508-21 (standard guide for quantitative analysis by energy-dispersive spectroscopy). Spectral processing includes ZAF and φ(ρz) matrix corrections, absorption and fluorescence yield modeling, and standards-based calibration traceable to NIST SRM reference materials. Full audit trail functionality supports GLP/GMP compliance, including user action logging, parameter versioning, and raw spectrum archiving per FDA 21 CFR Part 11 requirements.
Software & Data Management
Acquisition and analysis are managed via ESPRIT software, featuring a modular, scriptable interface compliant with Python 3.8+ and RESTful API protocols. Batch processing routines support automated acquisition of multiple regions of interest (ROIs), sequential tilt-series mapping, and real-time spectral library matching. Raw spectra are stored in vendor-neutral *.emsa format, preserving full detector metadata (live time, dead time, beam energy, working distance). Quantitative reports include element mass fractions, atomic percentages, detection limits (3σ), and uncertainty propagation based on counting statistics and peak deconvolution residuals. Data export supports HDF5, CSV, and MRC formats for interoperability with third-party tomography and machine learning pipelines.
Applications
- Nanoscale phase identification and interfacial chemistry in battery cathode materials, catalysts, and 2D heterostructures.
- Quantitative segregation analysis at grain boundaries and dislocation cores in structural alloys.
- In situ elemental evolution tracking during thermal annealing or electrochemical cycling.
- Light-element mapping (Be, B, C, N, O, F) in polymers, oxides, and biological specimens using windowless operation.
- Correlative EDS–EELS analysis for complementary bonding and compositional insights in advanced ceramics and quantum materials.
FAQ
What is the minimum detectable element with the windowless detector option?
Beryllium (Be, Z=4) is routinely detected under optimized vacuum and low-voltage conditions (≤100 kV), subject to sample preparation quality and carbon contamination control.
Can the QUANTAX TEM/STEM system be retrofitted onto existing TEMs?
Yes—mechanical adapters and flange kits are available for JEOL JEM-ARM series, Thermo Fisher Titan Krios, and Hitachi HT7800 platforms; installation requires alignment verification by certified field application engineers.
Does ESPRIT software support automated batch quantification across multiple samples?
Yes—script-driven workflows enable unattended ROI selection, background subtraction, peak integration, and report generation with configurable pass/fail thresholds per element.
How is detector stability maintained during long-duration mapping?
Real-time temperature stabilization (±0.1°C) and active drift compensation using fiducial markers ensure sub-pixel registration fidelity over acquisitions exceeding 24 hours.
Is spectral deconvolution performed in real time during acquisition?
Peak fitting and background modeling occur post-acquisition by default; however, live spectral preview with Gaussian-Lorentzian convolution is available for rapid qualitative assessment.


