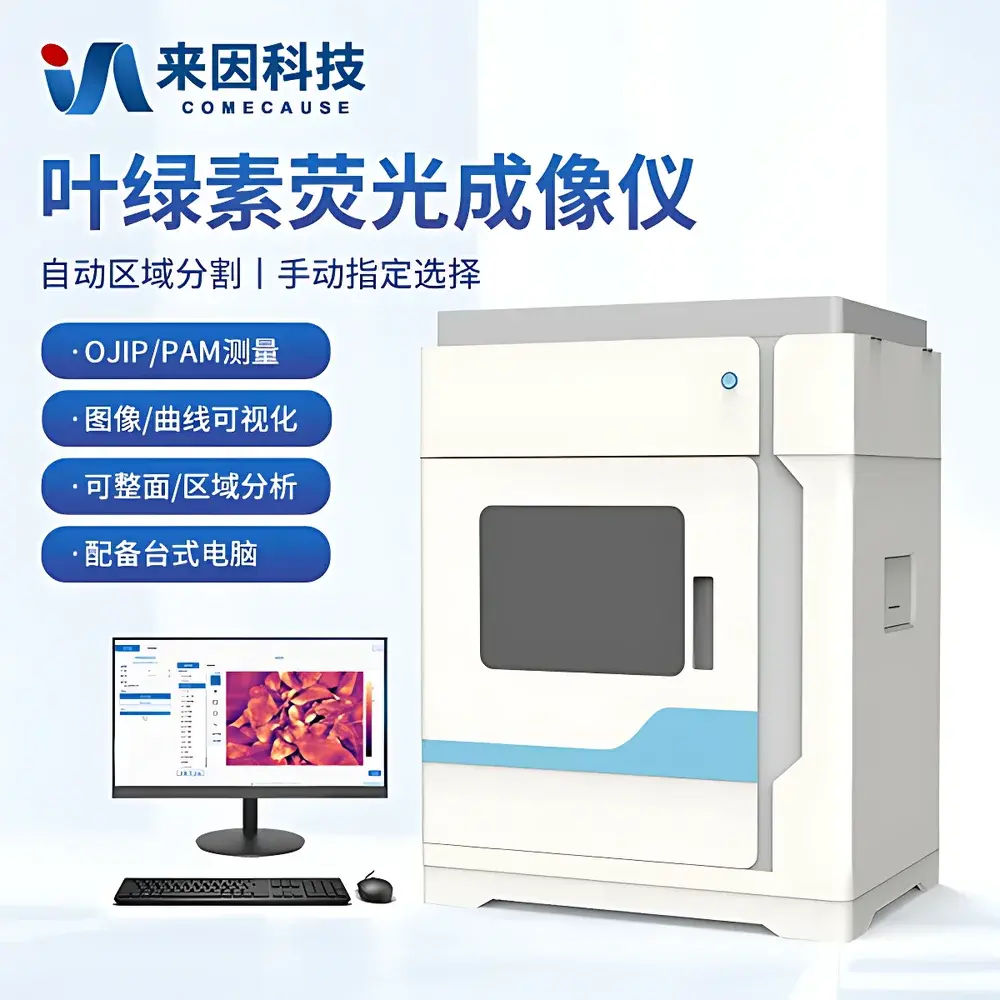
COMECAUSE IN*LeafClear Chlorophyll Fluorescence Imaging System with OJIP Kinetics Analysis
| Brand | COMECAUSE |
|---|---|
| Model | IN*LeafClear |
| Camera Resolution | 1608 × 1104 |
| Pixel Size | 9 µm × 9 µm |
| Frame Rate | 100 fps |
| Bit Depth | 12-bit |
| Interface | USB 3.0 |
| Lens Focal Length | 12 mm |
| Max Aperture | F/2.8 (adjustable) |
| HFOV | 62.11° |
| VFOV | 44.83° |
| Max Imaging Area | 50 cm × 35 cm |
| Excitation Wavelengths | 450 nm (blue), 630 nm (red), 730 nm (far-red) |
| LED Irradiance Range | 90–1440 µmol/(m²·s) |
| OJIP Acquisition Duration | 0.1–1.0 s (10 ms min. interval) |
| PAM Sampling Interval | 100 ms min. |
| Fluorescence Dynamic Range | 0–4095 (12-bit) |
| SNR | >100:1 |
| Repeatability (CV) | <3% |
| Linearity (R²) | >0.999 |
| Fv/Fm Accuracy | ±0.005 |
| ΦPSII Accuracy | ±0.01 |
| NPQ Accuracy | ±0.1 |
| Spatial Resolution | ~0.3 mm/pixel at 50 cm working distance |
Overview
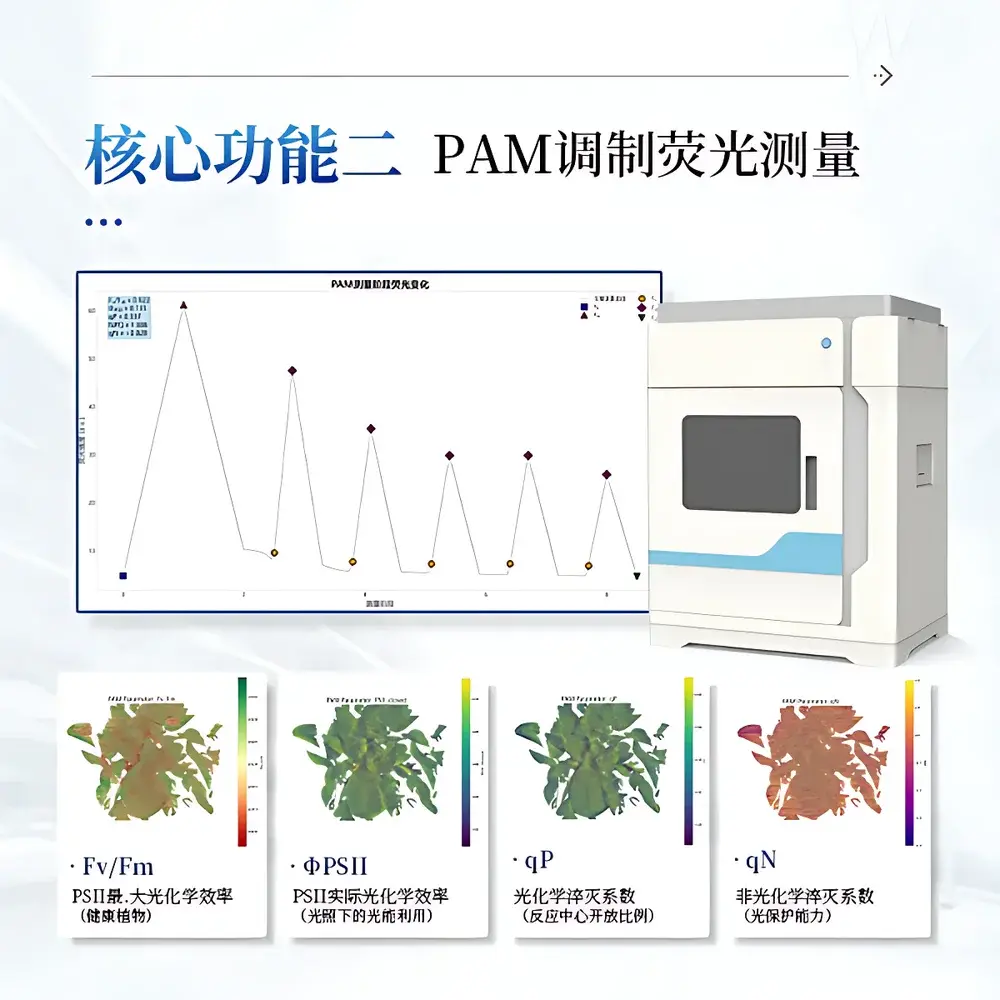
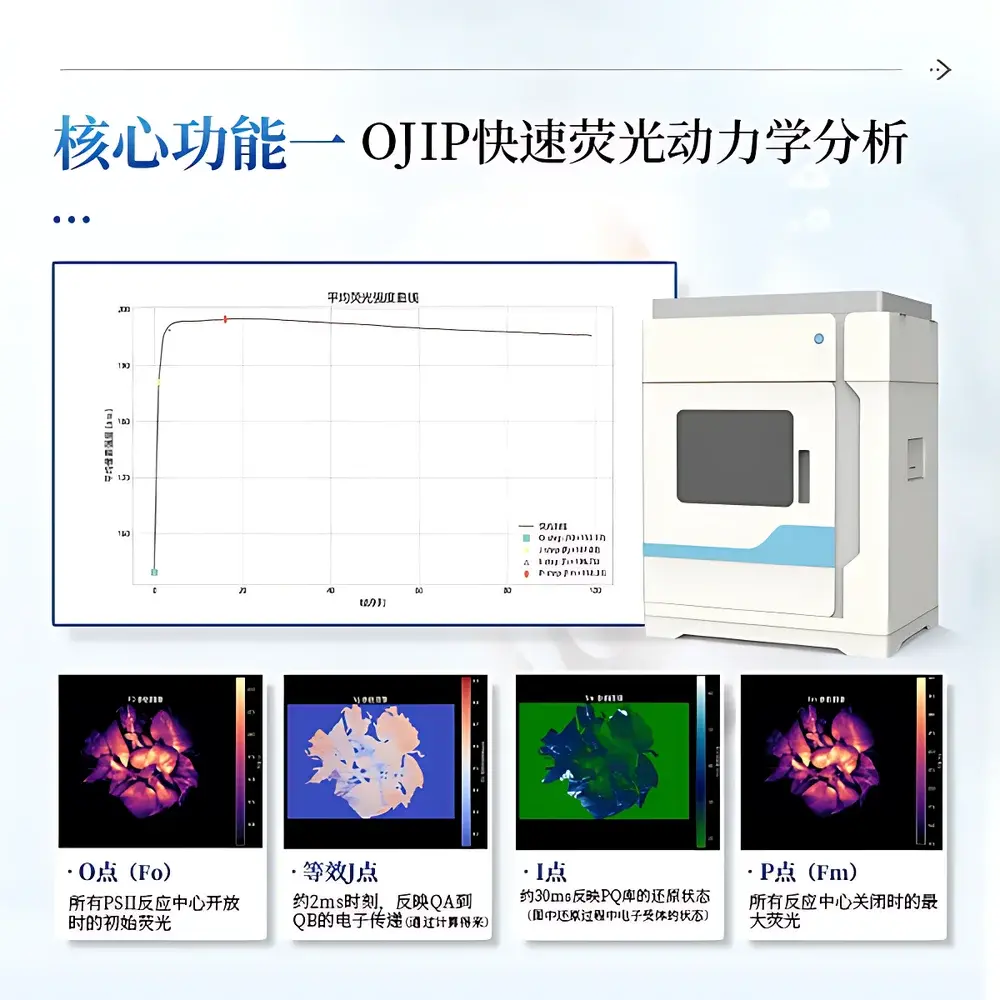
The COMECAUSE IN*LeafClear Chlorophyll Fluorescence Imaging System is a high-resolution, dual-mode quantitative phenotyping platform engineered for non-invasive, spatially resolved assessment of photosynthetic performance in intact plant tissues. It operates on the biophysical principle of chlorophyll a fluorescence induction kinetics—leveraging the intrinsic optical signature of Photosystem II (PSII) electron transport to report on photochemical efficiency, energy partitioning, and stress-induced perturbations. The system integrates two complementary measurement paradigms: (1) OJIP transient analysis, which captures the millisecond-scale fluorescence rise from Fo to Fm under saturating actinic light following dark adaptation, and (2) Pulse-Amplitude-Modulated (PAM) fluorometry, enabling real-time tracking of PSII quantum yield (ΦPSII), photochemical (qP) and non-photochemical quenching (NPQ), and electron transport rate (ETR) under dynamic light regimes. Unlike point-measurement fluorometers, IN*LeafClear delivers full-field 2D parameter maps—enabling pixel-wise quantification of heterogeneity across leaves, rosettes, or multi-plant arrays. Its architecture conforms to GLP-aligned experimental design principles, supporting traceable, repeatable, and statistically robust comparative phenotyping.
Key Features
- High-fidelity CMOS imaging sensor (1608 × 1104 pixels, 12-bit depth, 100 fps) optimized for low-light fluorescence capture with >100:1 signal-to-noise ratio
- Dual-wavelength LED excitation module: 450 nm (blue, for OJIP saturation pulses and Fo/Fm determination), 630 nm (red, for PAM actinic illumination), and 730 nm (far-red, for QA⁻ reoxidation during Fo′ measurement)
- Precisely calibrated irradiance control (90–1440 µmol/(m²·s)) with 1% resolution and sub-millisecond LED response time
- Optimized optical path: f/2.8 adjustable aperture lens (12 mm focal length) delivering uniform illumination and sharp focus across a 50 cm × 35 cm field-of-view at standard working distance
- Native support for both standardized OJIP protocols (per Strasser et al., 2004) and PAM-based kinetic assays (per Schreiber et al., 1986), with configurable dark adaptation (0–3600 s), pulse timing, and monitoring intervals
- Embedded JIP-test algorithm suite for calculation of biophysical parameters including ABS/RC, TR₀/RC, ETo/RC, DI₀/RC, PIABS, M₀, Vj, and Area—fully compliant with internationally accepted fluorescence-derived energy flux formalism
Sample Compatibility & Compliance
The IN*LeafClear system accommodates a broad range of botanical specimens without physical contact or sample preparation: detached leaves, whole seedlings (Arabidopsis, rice, wheat), potted plants up to 40 cm height, and multi-plate growth arrays. Its non-destructive operation enables longitudinal monitoring of the same individual over days or weeks—critical for developmental studies and stress time-series experiments. All hardware and firmware components are designed to meet IEC 61000-6-3 (EMC emission) and IEC 61000-6-2 (immunity) standards. Data acquisition workflows support audit-trail generation and metadata embedding (timestamp, irradiance setting, exposure duration, user ID), facilitating alignment with ISO/IEC 17025 requirements for testing laboratories and enabling retrospective validation per FDA 21 CFR Part 11 when deployed in regulated agricultural biotechnology or crop protection research environments.
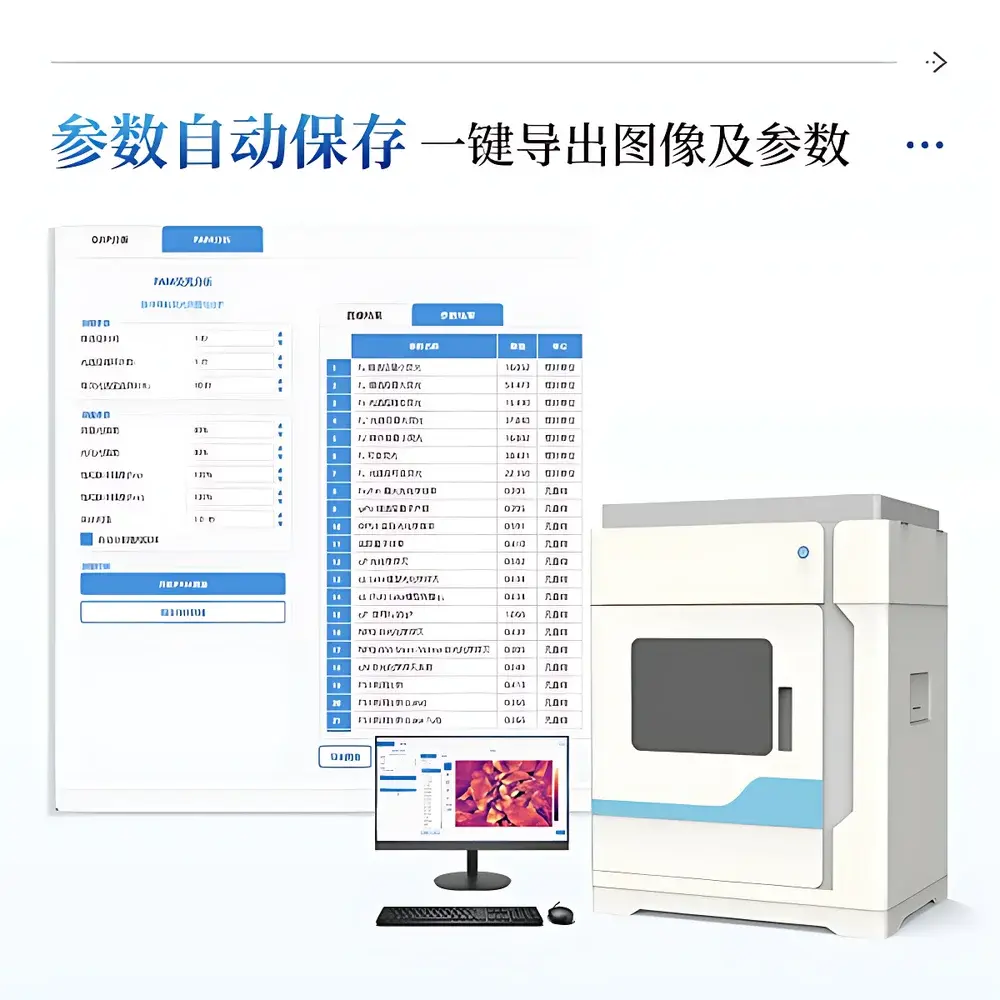
Software & Data Management
The IN*LeafClear Control & Analysis Suite provides a unified graphical interface with real-time preview, synchronized multi-parameter acquisition, and post-hoc spatial analytics. It supports bilingual operation (English/Chinese) with persistent language-state retention. Core software capabilities include:
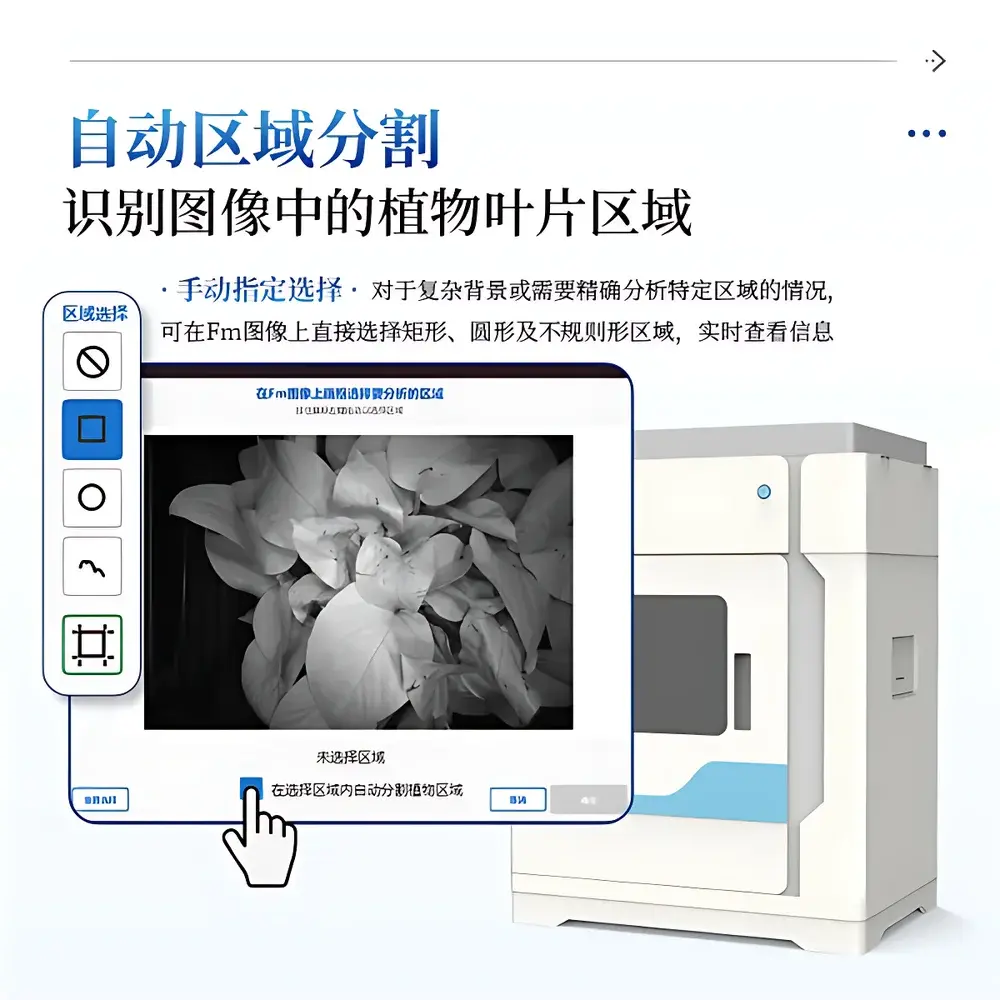
- Automated leaf segmentation using adaptive thresholding and morphological filtering—configurable to retain or exclude petioles, veins, or necrotic regions
- Region-of-interest (ROI) definition via freehand, rectangular, circular, or polygonal selection—with instantaneous statistical summary (mean, SD, min/max) per parameter map
- Scientific visualization: Jet and viridis colormaps with auto-scaled or user-defined intensity ranges; overlay of false-color fluorescence images onto grayscale reference frames
- Export pipeline: PNG (full-resolution, lossless), CSV (tabular parameters with units and uncertainty estimates), and Excel-compatible XLSX (structured by experiment, treatment, and timepoint)
- Parameter configuration persistence: all instrument settings—including LED intensities, sampling intervals, and dark adaptation durations—are saved per protocol profile and auto-loaded on session launch
All exported datasets include embedded EXIF-style metadata, ensuring full experimental provenance for reproducibility and third-party analysis.
Applications
The IN*LeafClear system serves as a primary phenotyping tool across academic and industrial plant science domains:
- Photosynthetic physiology: Quantifying PSII antenna size (ABS/RC), electron transport capacity (ETo/RC), and photoprotective dissipation (DI₀/RC) under controlled environmental gradients
- Abiotic stress phenotyping: Early detection of drought-induced decline in Fv/Fm (>3% reduction precedes visible wilting); thermal resilience screening via ΦPSII recovery kinetics post-heat shock
- Agrochemical evaluation: Dose–response characterization of herbicide mode-of-action (e.g., DCMU inhibition of QB site reflected in suppressed J–I–P phase amplitude); fertilizer nitrogen-use efficiency mapping via spatial ΦPSII homogeneity
- Disease diagnostics: Pre-symptomatic identification of pathogen infection through localized suppression of PIABS and elevated Vj—indicative of disrupted electron flow upstream of PSI
- Ecophysiology: Comparative analysis of sun/shade leaf acclimation via NPQ induction capacity and qP relaxation half-times across canopy layers
FAQ
What is the minimum detectable change in Fv/Fm that the system can resolve?
The system achieves ±0.005 absolute accuracy in Fv/Fm, enabling statistically significant discrimination of differences ≥0.01 under controlled replication (n ≥ 5).
Can the system perform simultaneous OJIP and PAM measurements on the same leaf?
No—OJIP and PAM are distinct operational modes requiring different illumination sequences and dark-adaptation protocols. However, sequential acquisition on the same leaf (with appropriate recovery intervals) is fully supported and commonly employed in experimental designs.
Is remote operation or integration with greenhouse control systems possible?
Yes—the software exposes a documented TCP/IP API for programmatic control and data ingestion, permitting synchronization with environmental controllers (e.g., climate loggers, irrigation triggers) and LIMS platforms via JSON or XML payloads.
How is calibration maintained across long-term deployments?
The system includes built-in reference fluorescence standards (certified stable dyes) and automated dark-current subtraction routines. Users are advised to perform weekly verification using a calibrated leaf mimic (e.g., MgO-coated reflectance tile) to confirm irradiance linearity and detector stability.
Does the software support batch processing of time-series image stacks?
Yes—batch ROI analysis, parameter extraction, and export are scriptable via the Python SDK included with the installation package, enabling high-throughput processing of hundreds of images per experiment.