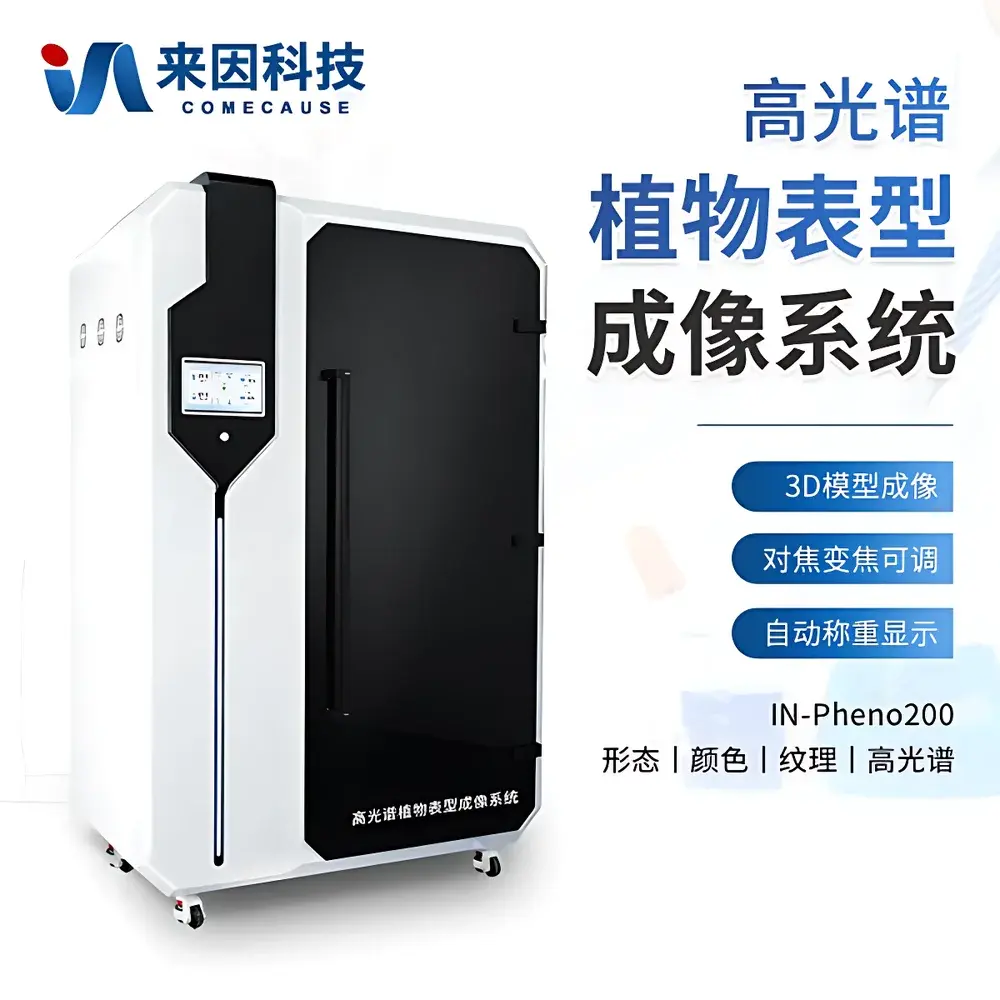
COMECAUSE IN-Pheno200 High-Spectral Plant Phenotyping Imaging System
| Brand | COMECAUSE |
|---|---|
| Origin | Shandong, China |
| Manufacturer Type | Original Equipment Manufacturer (OEM) |
| Model | IN-Pheno200 |
| Spectral Range | 400–1000 nm |
| Spectral Resolution | <2.5 nm |
| Number of Spectral Bands | 1200 |
| Spatial Imaging | Top, Side-Top & Side-Bottom Visible RGB Units + Side-Bottom Hyperspectral Unit |
| Plant Height Capacity | 300–1000 mm |
| Plant Width Capacity | 100–500 mm |
| Fresh Weight Range | 100–75,000 g |
| Enclosure Dimensions | 1500 × 830 × 2140 mm (L×W×H) |
| Light Source | Low-flicker, High-CRI Halogen Illumination |
| Camera Resolution | Up to 12 MP (RGB), Hyperspectral Frame Rate: 40 s per plant |
| Data Output Formats | .spe, .json, .tiff, .mp4, CSV |
| Software Platform | Windows-based with NVIDIA GPU acceleration (≥8 GB VRAM), ≥8 GB RAM, Intel i5 or higher |
Overview
The COMECAUSE IN-Pheno200 High-Spectral Plant Phenotyping Imaging System is a research-grade, integrated phenomics platform engineered for non-invasive, quantitative, and spatially resolved analysis of plant physiological and biochemical traits. It operates on the principle of hyperspectral imaging—capturing reflectance spectra across 1200 contiguous narrow bands from 400 to 1000 nm at sub-2.5 nm spectral resolution—and fusing this spectral dimension with high-resolution spatial imaging (top, side-top, and side-bottom views) and synchronized 3D reconstruction. Unlike conventional RGB or multispectral systems, the IN-Pheno200 generates a full 3D spatio-spectral data cube (x, y, λ), enabling pixel-level quantification of pigment composition, water status, structural integrity, and stress-induced biochemical shifts. Its optical architecture leverages stable halogen illumination with calibrated spectral uniformity and low temporal flicker, ensuring reproducible radiometric measurements under controlled environmental conditions. The system is designed for compliance with standard laboratory phenotyping workflows in plant physiology, ecology, and breeding programs where traceable, high-fidelity spectral data are required for model development and validation.
Key Features
- Multi-angle visible imaging suite (top-view, side-top, side-bottom) coupled with a dedicated side-bottom push-broom hyperspectral imager for complete plant surface coverage
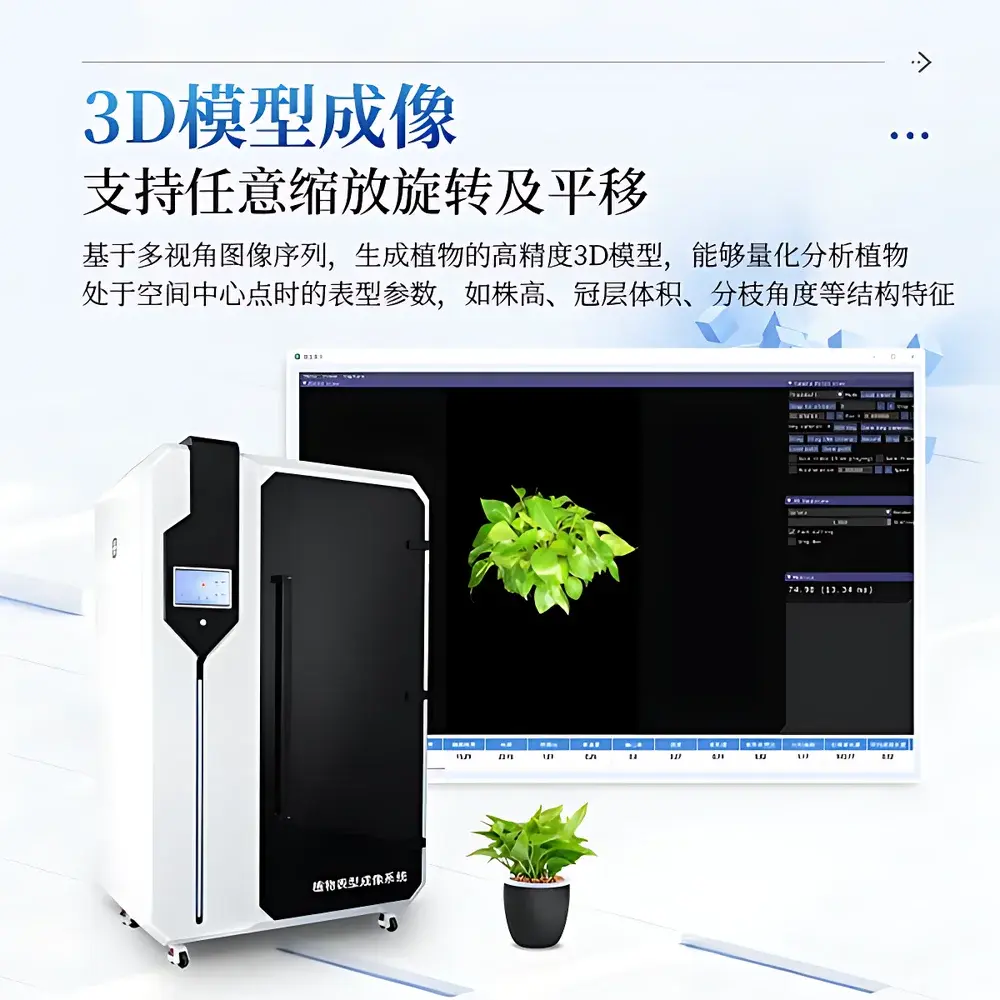
- Automated 3D morphological reconstruction using multi-view computer vision algorithms; supports real-time rotation, zoom, and translation of reconstructed models for volumetric and angular trait extraction
- Integrated precision weighing module synchronized with image acquisition—fresh weight automatically logged and correlated with spectral and morphological parameters
- Adaptive imaging protocol: system dynamically adjusts camera height, focus, and exposure based on plant dimensions; supports automatic tiling for specimens exceeding field-of-view limits
- Onboard environmental monitoring: embedded temperature and humidity sensors provide continuous logging for experimental metadata traceability
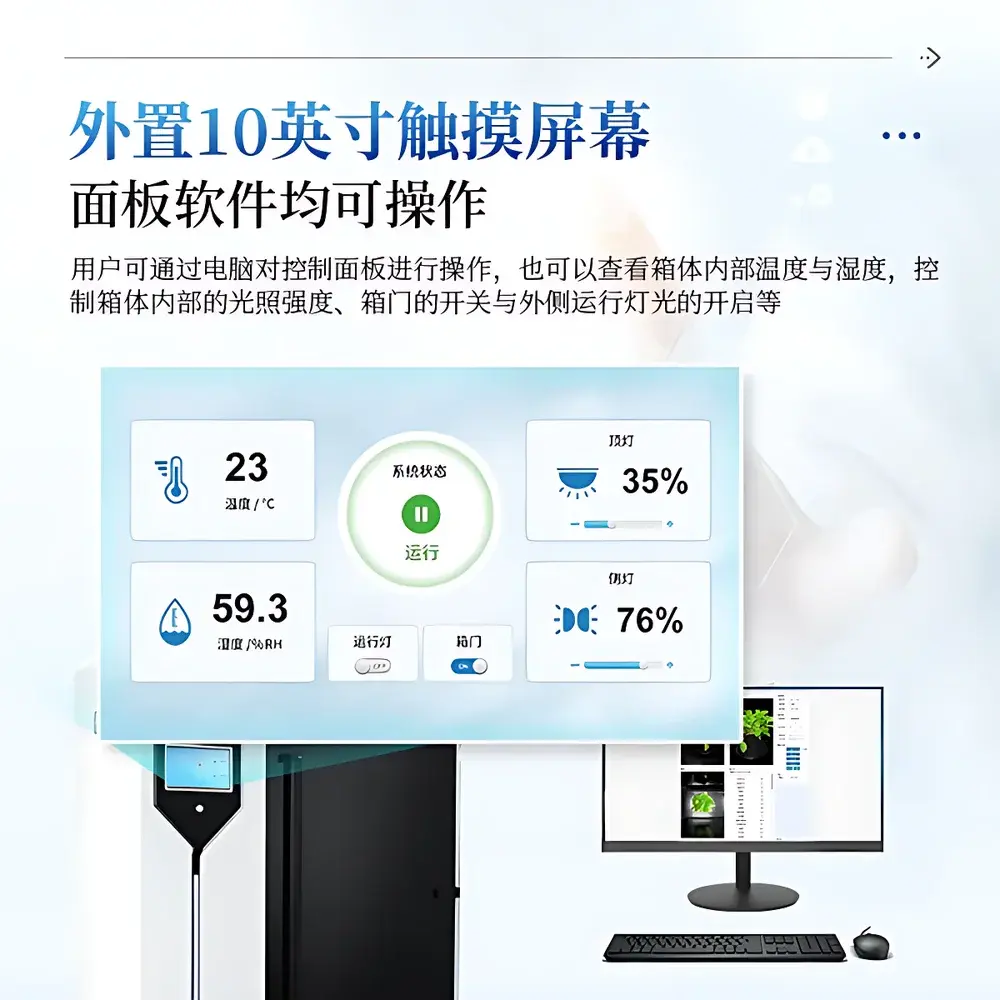
- Touch-enabled 10-inch control panel for local operation; full remote control via Windows-based software with GPU-accelerated processing pipelines
- Optical auto-focus and motorized zoom functionality with user-configurable focus modes (contrast-based, edge-detection, or manual override)
- Cloud-synced data management: device-bound encrypted upload of phenotype reports (.json), hyperspectral cubes (.spe), and 3D model videos (.mp4) to secure cloud storage with role-based access
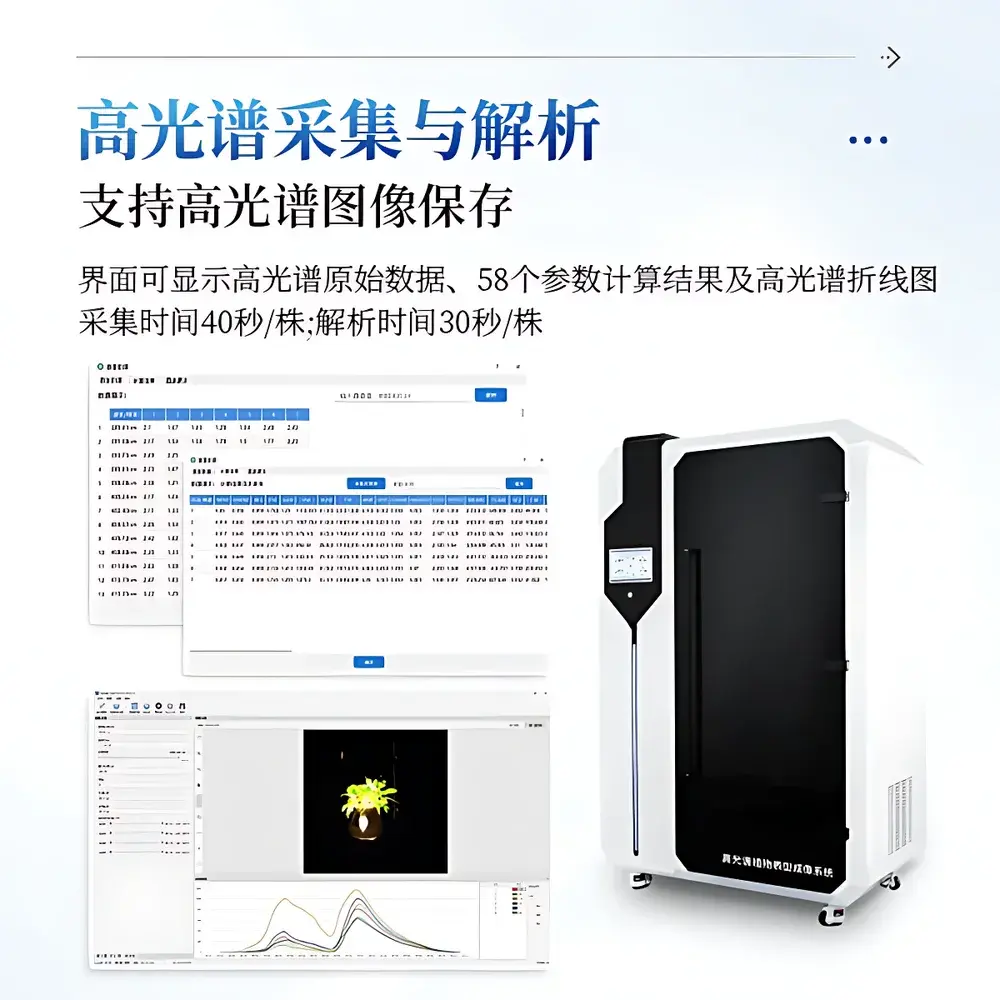
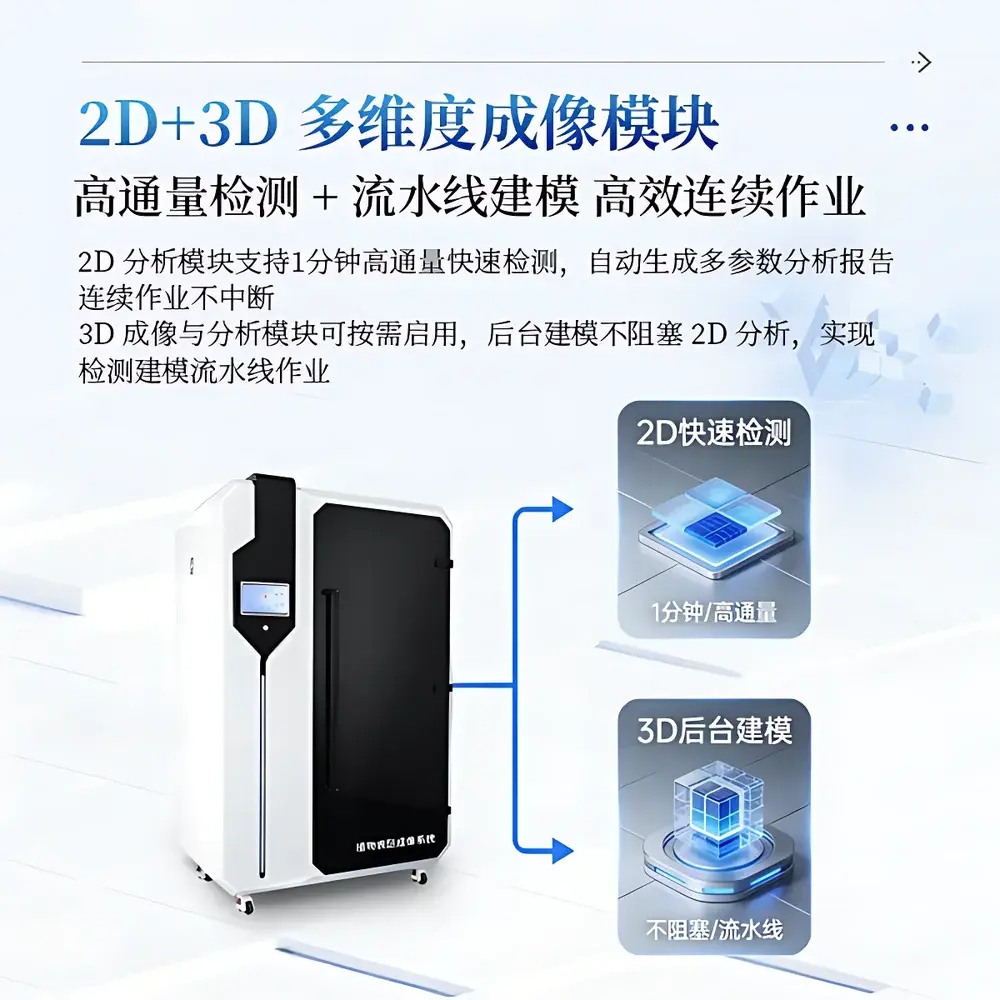
- Comprehensive software toolkit supporting batch 2D analysis (≤60 s/sample), parallel 3D modeling, and spectral index computation using standardized equations (e.g., NDVI, PRI, REIP, ARI, WI)
Sample Compatibility & Compliance
The IN-Pheno200 accommodates a broad range of herbaceous plant architectures—including Poaceae (e.g., maize, rice), Solanaceae (e.g., tomato, tobacco), Brassicaceae (e.g., Arabidopsis, canola), and Fabaceae (e.g., soybean, pea)—within defined dimensional constraints (300–1000 mm height; 100–500 mm width). Its enclosed chamber design ensures consistent illumination geometry and minimizes ambient interference, fulfilling requirements for GLP-aligned phenotyping experiments. All spectral calibration procedures follow NIST-traceable protocols, and raw hyperspectral data adhere to the Spectral Data Interchange Format (SDIF) conventions. The system supports audit trail generation per FDA 21 CFR Part 11 requirements when operated in validated environments, including timestamped operator actions, parameter modifications, and result exports. Environmental sensor outputs (temperature/humidity) are logged with ISO/IEC 17025-compliant metadata tagging, facilitating integration into LIMS and electronic lab notebook (ELN) systems.
Software & Data Management
The proprietary IN-PhenoSuite software provides a unified interface for instrument control, data acquisition, and advanced analytics. It implements automated workflows compliant with FAIR (Findable, Accessible, Interoperable, Reusable) data principles: all outputs include embedded metadata (plant ID, acquisition time, spectral calibration coefficients, environmental conditions). The software computes over 58 published vegetation indices—including EVI2, MTCI, PSRI, NPQI, and NIRvP—using peer-reviewed formulas aligned with USDA ARS, ESA, and ISPRS standards. Hyperspectral data export supports both vendor-neutral formats (.spe, .tiff) and machine-learning-ready tensors (.npy). Batch processing enables concurrent 2D trait extraction and queued 3D reconstruction without pipeline interruption. Export modules support customizable CSV templates for integration with R/Bioconductor, Python (scikit-learn, PyTorch), or commercial platforms such as JMP Genomics and SAS JMP Pro. Language localization includes English and Chinese UI toggle, with documentation conforming to ISO/IEC 26514 standards for technical product documentation.
Applications
The IN-Pheno200 serves three primary application domains: fundamental plant stress physiology, high-throughput phenotyping in breeding pipelines, and translational precision agriculture research. In controlled-environment studies, it enables longitudinal tracking of drought-induced stomatal closure via time-series NDVI and WI mapping, or early detection of fungal infection through localized PRI570 and ARI2 anomalies preceding visible necrosis. Within breeding programs, it delivers >200 morphological, textural, colorimetric, and spectral traits per plant—enabling genome-wide association studies (GWAS) linking spectral “fingerprints” to QTLs for nitrogen use efficiency or anthocyanin accumulation. For field-to-lab bridging, its calibrated spectral response allows cross-platform validation against airborne or UAV-mounted hyperspectral sensors, supporting upscaling of greenhouse-derived models to field-scale decision support systems. Applications extend to post-harvest quality assessment (e.g., maturity index derivation from BGI2 and NIR-Slope), fluorescence reporter quantification (GFP/RFP/FLuc), and abiotic stress screening (e.g., salinity-induced changes in CRI550 and SAVI).
FAQ
What spectral calibration standards are used during factory setup?
The system undergoes radiometric and spectral calibration using NIST-traceable white reference panels (Spectralon®) and mercury-argon emission lamps; full calibration reports are provided with each unit.
Can the IN-Pheno200 be integrated with existing LIMS or ELN platforms?
Yes—via RESTful API endpoints and configurable CSV/JSON export schemas that map to common ontology frameworks (e.g., Crop Ontology, Plant Trait Ontology).
Is GPU acceleration mandatory for real-time 3D reconstruction?
A minimum NVIDIA GPU with 8 GB VRAM is required for sub-minute 3D mesh generation; CPU-only mode is supported but increases reconstruction time by ≥5×.
How does the system handle specular reflection or shadow artifacts in dense canopies?
Multi-angle illumination geometry combined with polarization-sensitive preprocessing reduces glare; shadow compensation is applied during 3D fusion using photometric stereo algorithms.
Are spectral indices computed in real time or post-acquisition?
All indices are computed during post-processing; raw hyperspectral data is preserved unaltered to ensure reanalysis reproducibility.
Related Products