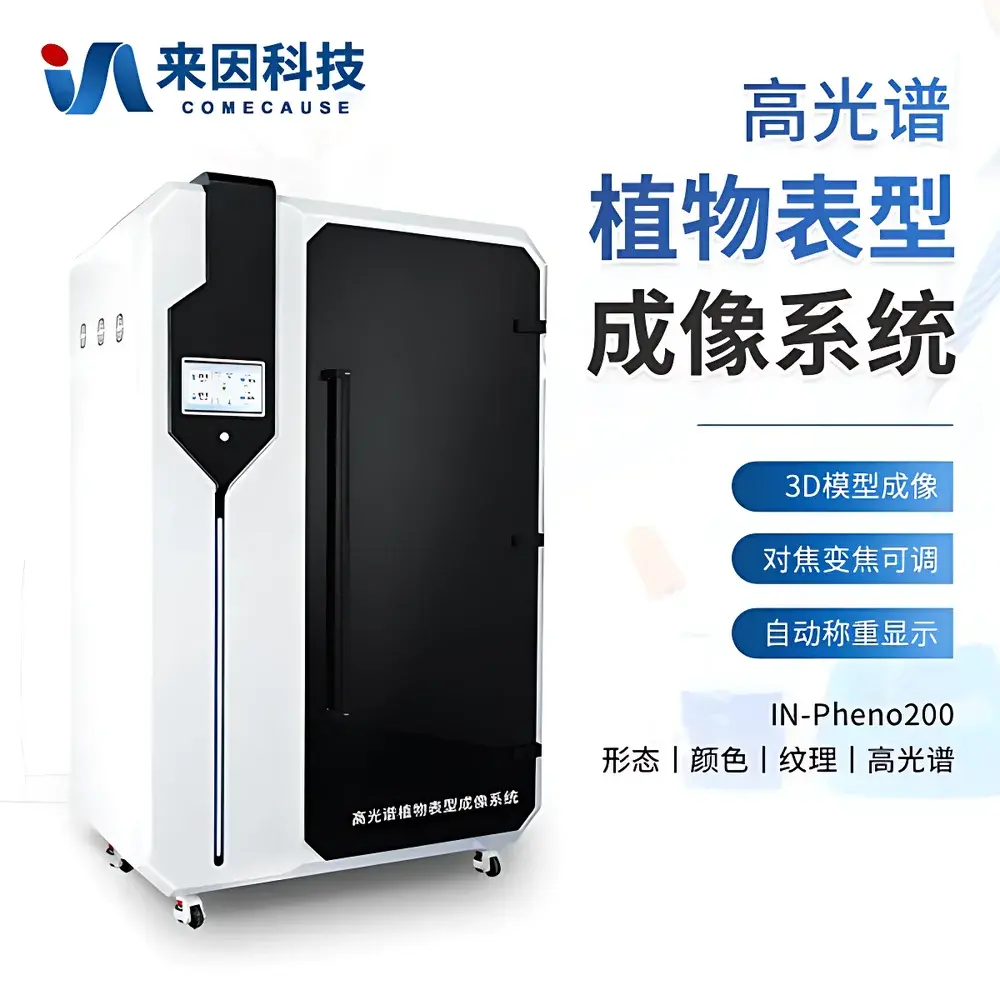
COMECAUSE IN-Pheno200 High-Spectral Plant Phenotyping Imaging System
| Brand | COMECAUSE |
|---|---|
| Origin | Shandong, China |
| Manufacturer Type | OEM Manufacturer |
| Country of Origin | China |
| Model | IN-Pheno200 |
| Price | USD 138,000 (FOB) |
| Plant Height Range | 300–1000 mm |
| Plant Width Range | 100–500 mm |
| Fresh Weight Capacity | 100–75,000 g |
| Spectral Range | 400–1000 nm |
| Spectral Resolution | < 2.5 nm |
| Spectral Bands | 1200 channels |
| Illumination Source | Low-flicker, high-CRI halogen lamp array |
| Enclosure Dimensions | 1500 × 830 × 2140 mm (L × W × H) |
| Imaging Sensor | 12 MP monochrome & RGB CMOS |
| 3D Reconstruction Method | Multi-view photogrammetry with AI-optimized feature matching |
| Data Output Formats | .spe, .json (analysis_result.json), .ply (3D mesh), .mp4 (model animation), CSV/Excel (phenotypic metrics) |
| Software Platform | Windows 10/11 (64-bit), Intel Core i5 or higher, NVIDIA GPU ≥ 8 GB VRAM, RAM ≥ 8 GB |
Overview
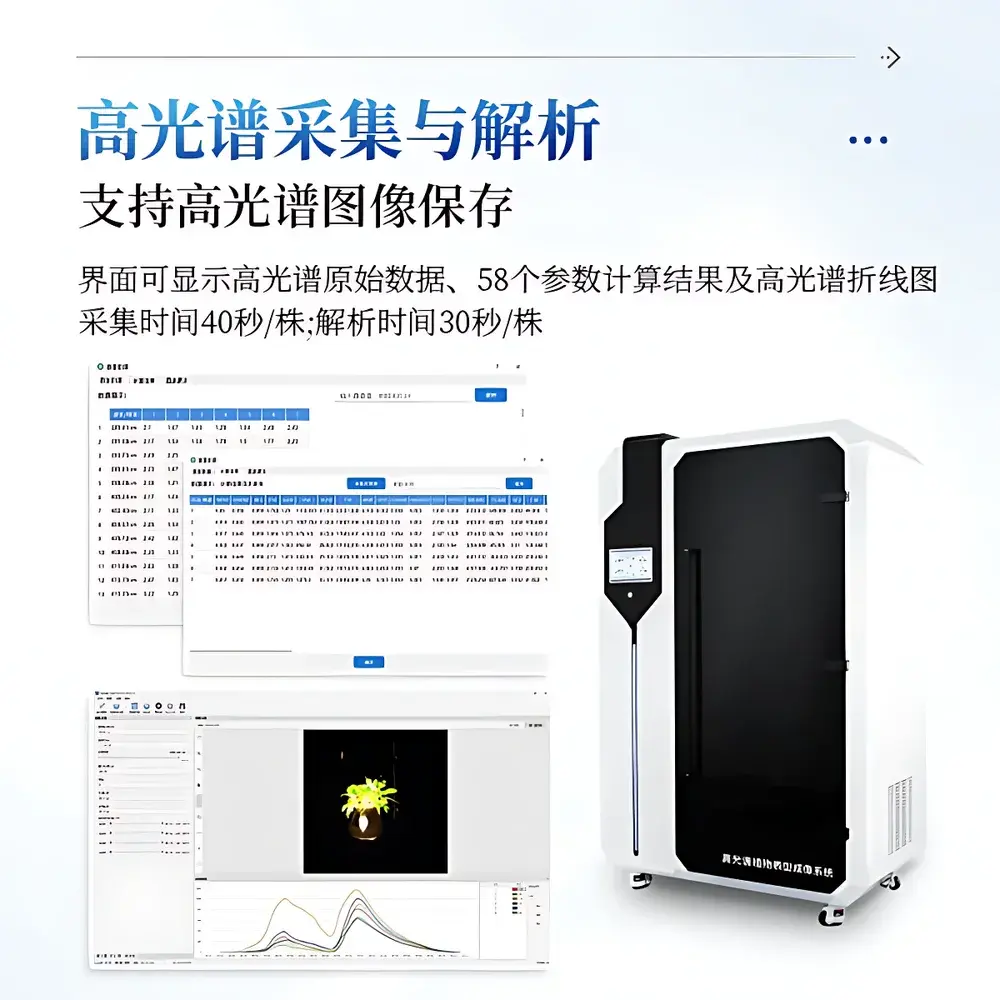
The COMECAUSE IN-Pheno200 High-Spectral Plant Phenotyping Imaging System is a fully integrated, non-destructive phenomics platform engineered for quantitative, multi-dimensional characterization of plant structure, physiology, and biochemistry under controlled environmental conditions. It operates on the principle of hyperspectral reflectance imaging—capturing contiguous spectral data across 1200 narrow bands (400–1000 nm) at sub-2.5 nm resolution—combined with synchronized multi-angle visible-light imaging and AI-driven 3D photogrammetric reconstruction. Unlike conventional RGB-only or discrete-band sensors, the IN-Pheno200 resolves subtle shifts in pigment composition, water status, cellular integrity, and secondary metabolite accumulation through physically grounded vegetation indices (e.g., PRI, WI, ARI, MCARI, CRI) derived from first-principles radiometric calibration. Its modular optical architecture includes top-, side-top-, and side-bottom-mounted visible imaging units and a side-bottom-mounted push-broom hyperspectral camera, enabling full circumferential data acquisition as specimens rotate on a motorized turntable. The system delivers simultaneous extraction of morphological, chromatic, textural, and spectral phenotypes—each traceable to ISO/IEC 17025-aligned measurement protocols—making it suitable for GLP-compliant research, breeding program audits, and regulatory submission support.
Key Features
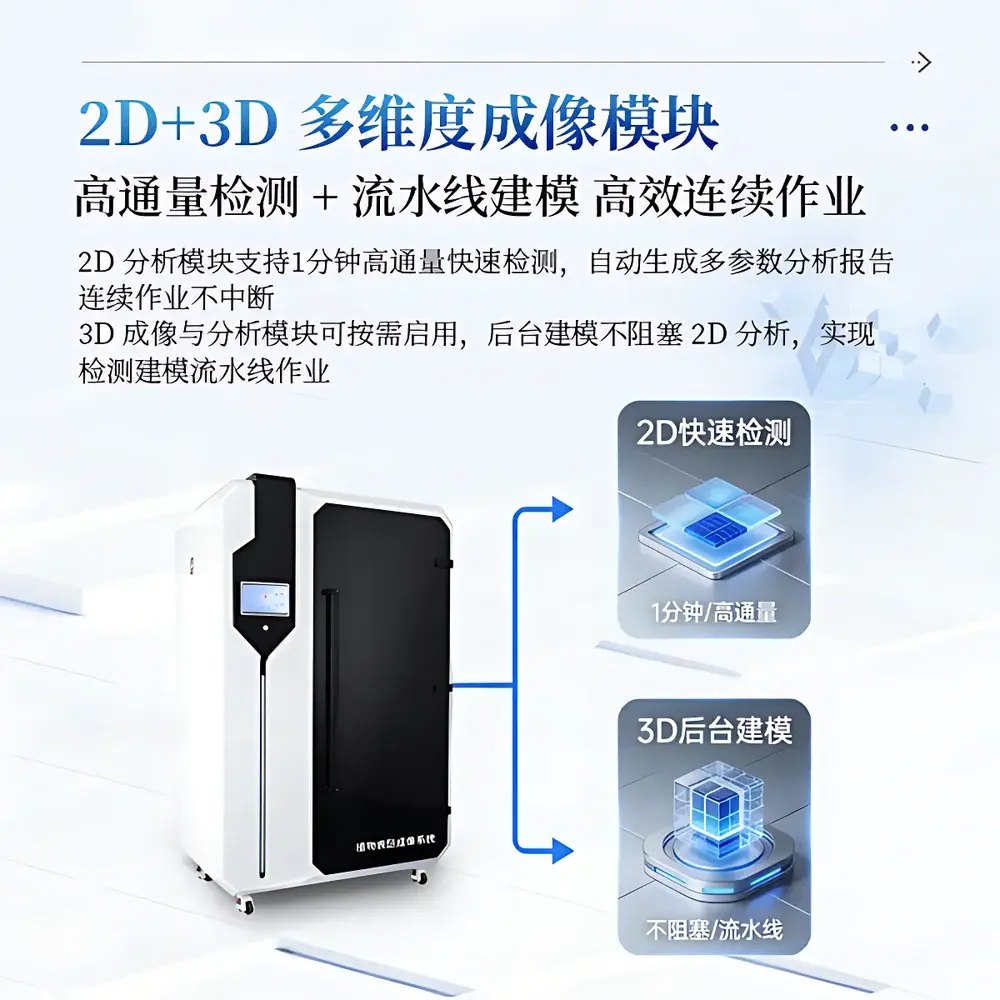
- Multi-modal imaging suite: Co-registered visible (RGB + Lab + HSV), texture (GLCM-based ASM, Contrast, Entropy, SSIM), and hyperspectral (1200-band, 400–1000 nm) data acquisition per scan cycle
- Automated adaptive imaging: Real-time plant dimension assessment triggers dynamic lens positioning (motorized Z-axis lift), focal plane optimization, and image tiling for specimens exceeding field-of-view limits
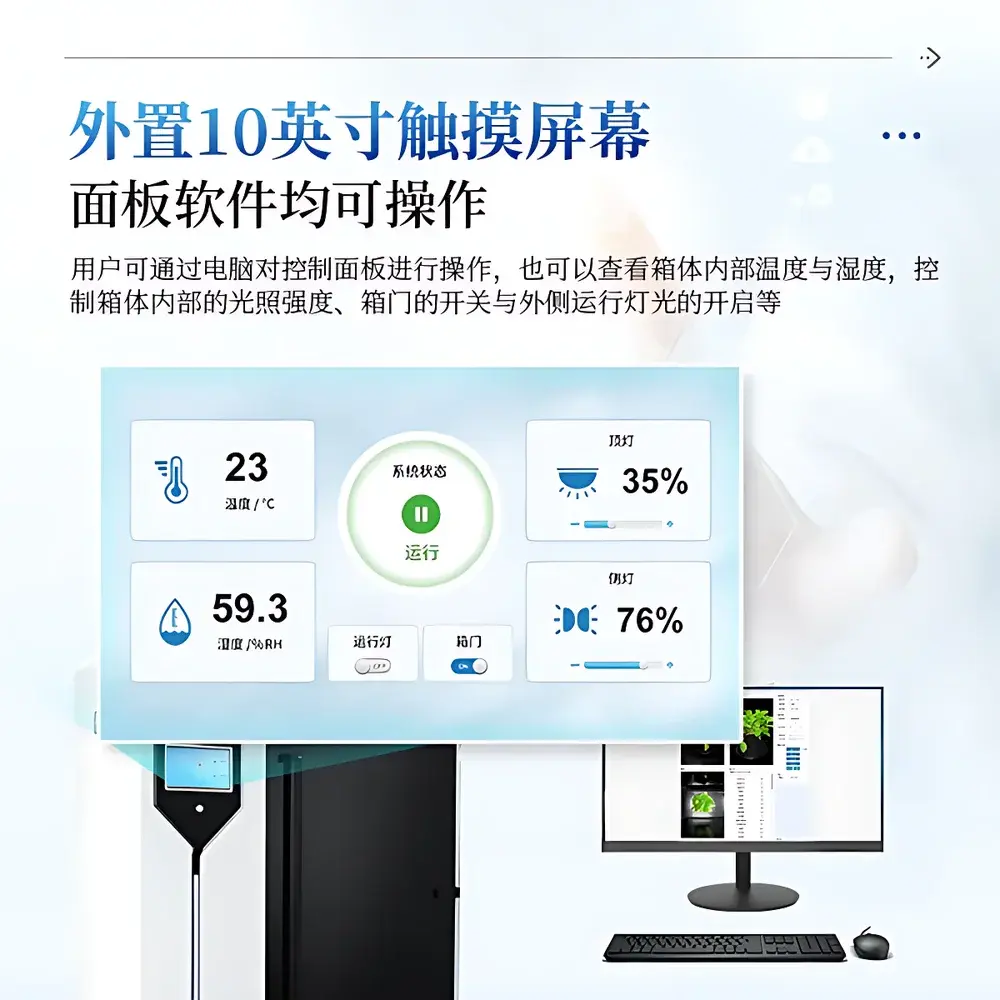
- Integrated environmental monitoring: Onboard temperature and humidity sensors log chamber conditions synchronously with image capture; data embedded in metadata headers (EXIF/XMP)
- High-throughput 2D analysis pipeline: Processes single-plant morphology, color, and texture parameters in ≤60 s; supports batch mode with queue management and parallel execution
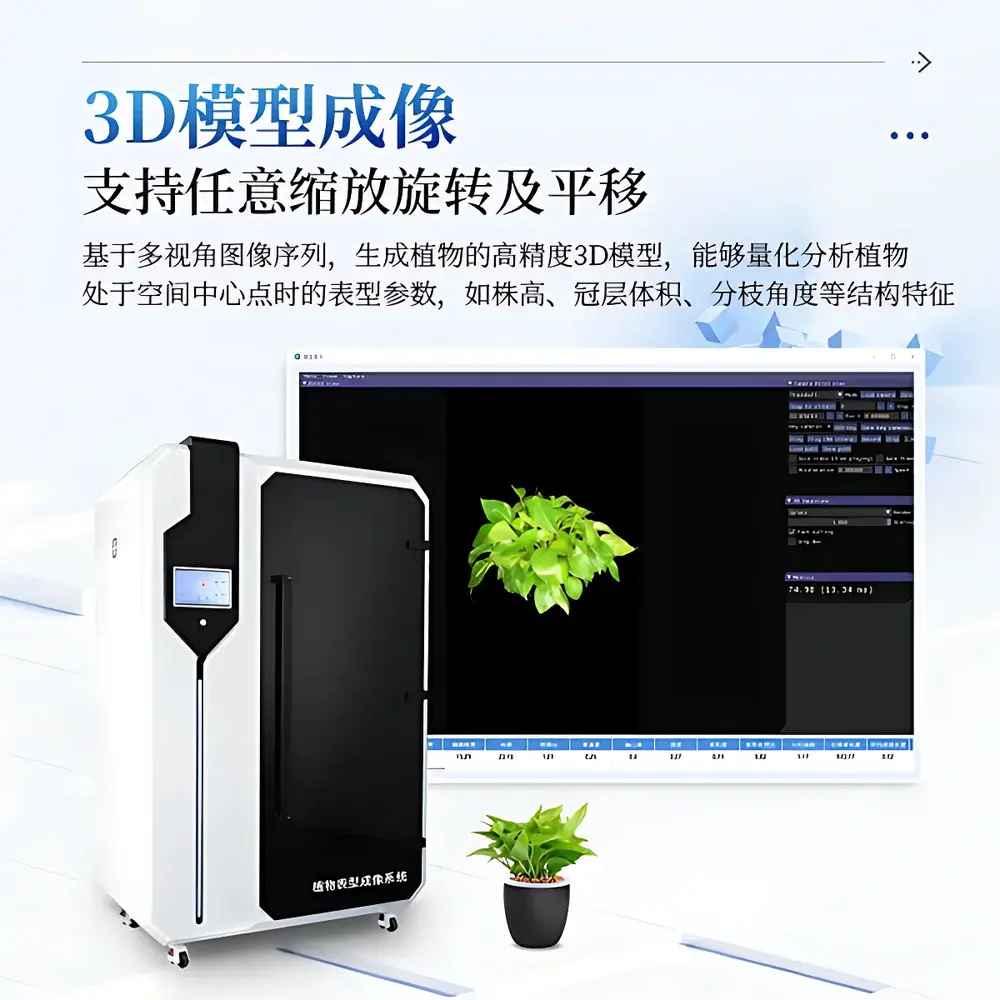
- Real-time 3D reconstruction engine: Generates geometrically accurate, textured point clouds and mesh models (PLY format) from ≥12 calibrated viewpoints; enables volumetric, angular, and spatial metric derivation (e.g., canopy volume, branch angle distribution, projection area ratio)
- Fully traceable software workflow: All index calculations follow peer-reviewed equations (e.g., NDVI = (NIR − Red)/(NIR + Red)); raw spectra stored in ENVI-compatible .spe format; analysis logs include timestamp, operator ID, instrument serial number, and calibration certificate reference
- Cloud-enabled data governance: Encrypted HTTPS upload to tenant-isolated cloud storage; role-based access control (RBAC); audit trail compliant with FDA 21 CFR Part 11 requirements for electronic records and signatures
- Hardware safety architecture: Dual-limit mechanical stops, door interlock switches, thermal cutoffs, and real-time position feedback prevent operational overtravel or user exposure hazards
Sample Compatibility & Compliance
The IN-Pheno200 accommodates intact, living plants within height (300–1000 mm), width (100–500 mm), and fresh weight (100–75,000 g) constraints—covering representative species from Poaceae (e.g., maize, rice), Solanaceae (tomato, pepper), Brassicaceae (Arabidopsis, canola), and Fabaceae (soybean, pea). Its non-contact, non-invasive design ensures longitudinal monitoring without growth perturbation, satisfying OECD Test Guideline 111 (phytotoxicity) and ISO 11269-2 (soil-plant interaction) requirements for repeated-measures experimental design. All spectral indices are computed using NIST-traceable reflectance standards (Spectralon® 99% white, 2% black) and validated against ASTM E275–22 (standard practice for describing and measuring performance of spectrophotometers). The system meets IEC 61000-6-3 (EMC emission) and IEC 61000-6-2 (immunity) standards; enclosure construction complies with IP54 dust/water ingress protection per IEC 60529.
Software & Data Management
The proprietary IN-PhenoSuite software (v4.2+) provides a unified interface for instrument control, image acquisition, batch processing, visualization, and export. It implements a hierarchical data model where each sample is assigned a unique UUID linked to raw images (.tiff/.spe), processed metrics (CSV/JSON), 3D meshes (.ply), and analysis logs. Index computations adhere strictly to published literature: PRI570 = (R570 − R531)/(R570 + R531); WI = R900/R970; ARI = (1/R550 − 1/R700); CRI550 = R470/R550. All outputs include uncertainty propagation estimates based on sensor SNR and calibration drift history. Export modules support MIAME/MINSEQ-compliant metadata tagging and direct integration with BreedBase, BrAPI, and Crop Ontology via RESTful API. Audit trails record every parameter change, file modification, and user login event—including timestamps, IP addresses, and cryptographic hashes—enabling full reproducibility and regulatory review.
Applications
- Early biotic stress detection: Quantifies pre-symptomatic changes in PRI, WI, and MCARI during fungal colonization (e.g., Rhizoctonia solani, Blumeria graminis), enabling intervention 3–7 days before visual lesion appearance
- Non-destructive quality phenotyping: Correlates ARI, WI, and maturity indices with Brix, anthocyanin concentration, and firmness in grapevine, tomato, and tea—supporting harvest timing decisions across heterogeneous canopies
- Abiotic stress response profiling: Tracks synchronized declines in PRI (photosynthetic efficiency), WI (water potential), and CRI700 (carotenoid photoprotection) under drought, salinity, or heat regimes—facilitating QTL mapping of physiological resilience traits
- Architectural trait quantification: Measures 3D branching architecture (branch angle, fractal dimension, skeleton length), leaf orientation, and canopy light interception efficiency—critical for ideotype modeling in crop design
- High-throughput screening: Supports >200 plants/day in breeding nurseries when deployed with robotic handling; integrates with seedling trays and conveyor-based staging systems
FAQ
What spectral calibration standards are used, and how frequently must they be re-applied?
The system ships with factory-applied NIST-traceable reflectance standards (Spectralon® 99% and 2%). Users perform daily dark-current and white-reference acquisitions prior to scanning sessions. Full spectral recalibration is recommended every 6 months or after mechanical impact, using the included portable calibration kit.
Is the 3D reconstruction algorithm compatible with external ground-truth measurements (e.g., LiDAR or manual calliper data)?
Yes. IN-PhenoSuite exports aligned point clouds in standard PLY format with embedded coordinate system metadata (EPSG:4326). Users may import independent validation datasets to compute RMSE, bias, and correlation coefficients directly within the software’s Validation Dashboard module.
Does the software support custom index development and scripting?
Yes. The Analysis Engine includes Python 3.9 runtime with NumPy, SciPy, and scikit-image libraries pre-installed. Users may define custom indices via .py scripts that interface with the internal spectral cube object; all custom outputs are logged and version-controlled alongside native metrics.
How is data integrity ensured during cloud synchronization?
All uploads use TLS 1.3 encryption; files are segmented, hashed (SHA-256), and verified upon receipt. Cloud storage employs AES-256 encryption-at-rest and automatic versioning. Failed transfers trigger automatic retry with exponential backoff and notification via SMTP/SMS.
Can the system operate unattended for multi-day time-series experiments?
Yes. Scheduled scan sequences (with programmable intervals from 15 min to 24 h) run autonomously. Environmental logs, power status, and storage capacity are monitored continuously; alerts activate via email/SNMP if thresholds are breached.
Related Products