
ESEN Vis-NIR Spectral Modeling Service for Cadmium Contamination in Lettuce
| Brand | ESEN |
|---|---|
| Origin | Zhejiang, China |
| Manufacturer Type | Authorized Distributor |
| Regional Category | Domestic (China) |
| Model | Proprietary Algorithm Suite |
| Price | USD 1,400 (approx.) |
| Software Type | Hyperspectral Quantitative Modeling Platform |
Overview
ESEN Vis-NIR Spectral Modeling Service for Cadmium Contamination in Lettuce is a laboratory-developed chemometric modeling service designed to enable rapid, non-destructive quantification of cadmium (Cd) concentration in fresh lettuce tissue using visible–near-infrared (Vis-NIR, 400–800 nm) reflectance spectroscopy. The service delivers a validated, application-ready predictive model calibrated against reference Cd measurements (e.g., ICP-MS or graphite furnace AAS), engineered for integration into inline monitoring systems or portable field spectrometers. Unlike conventional wet-chemistry methods requiring sample digestion and lab-based instrumentation, this service leverages the intrinsic optical response of lettuce tissue—modulated by Cd-induced physiological changes including chlorophyll degradation, cell wall structural alteration, and water status shifts—to establish robust spectral–concentration correlations. The resulting model is optimized for real-time deployment in controlled-environment agriculture (CEA), post-harvest sorting lines, or regulatory screening workflows where throughput, sample integrity, and operational continuity are critical.
Key Features
- Proprietary algorithm pipeline integrating Savitzky-Golay smoothing, Standard Normal Variate (SNV), and Multiplicative Scatter Correction (MSC) for noise suppression and baseline stabilization
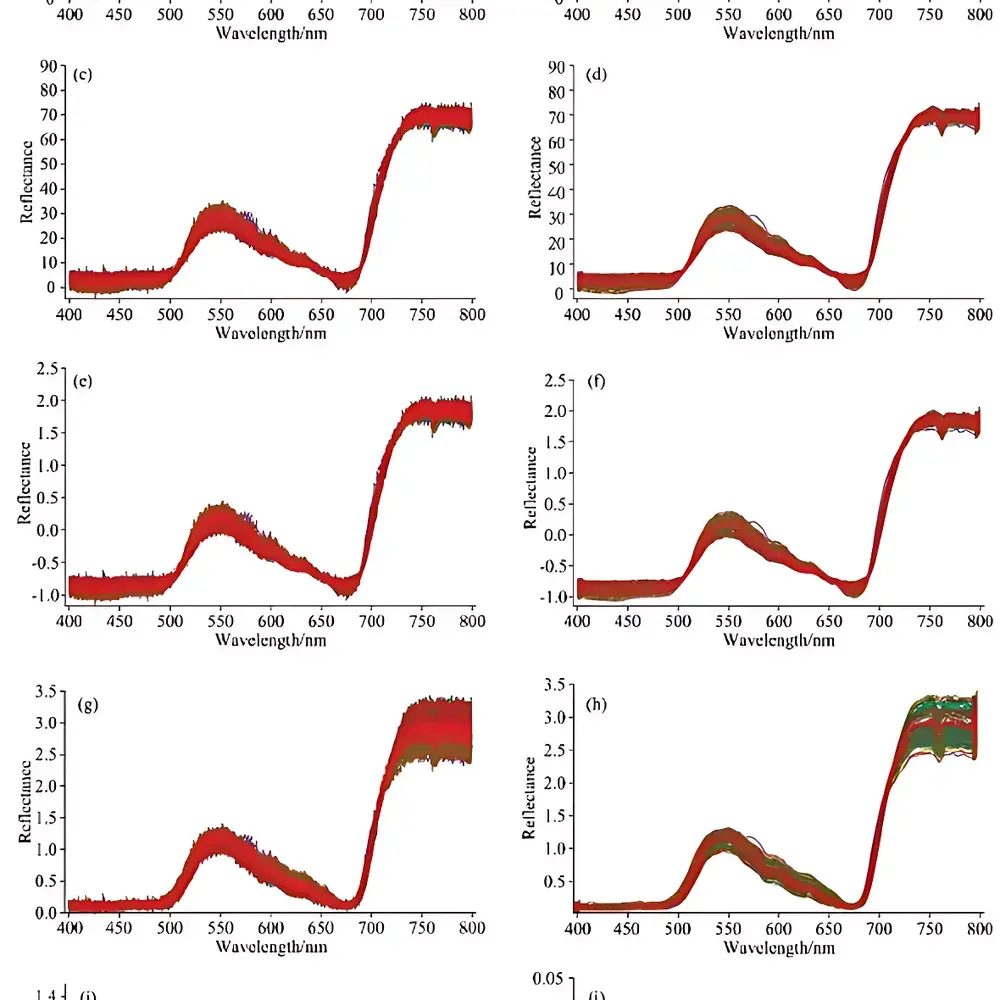
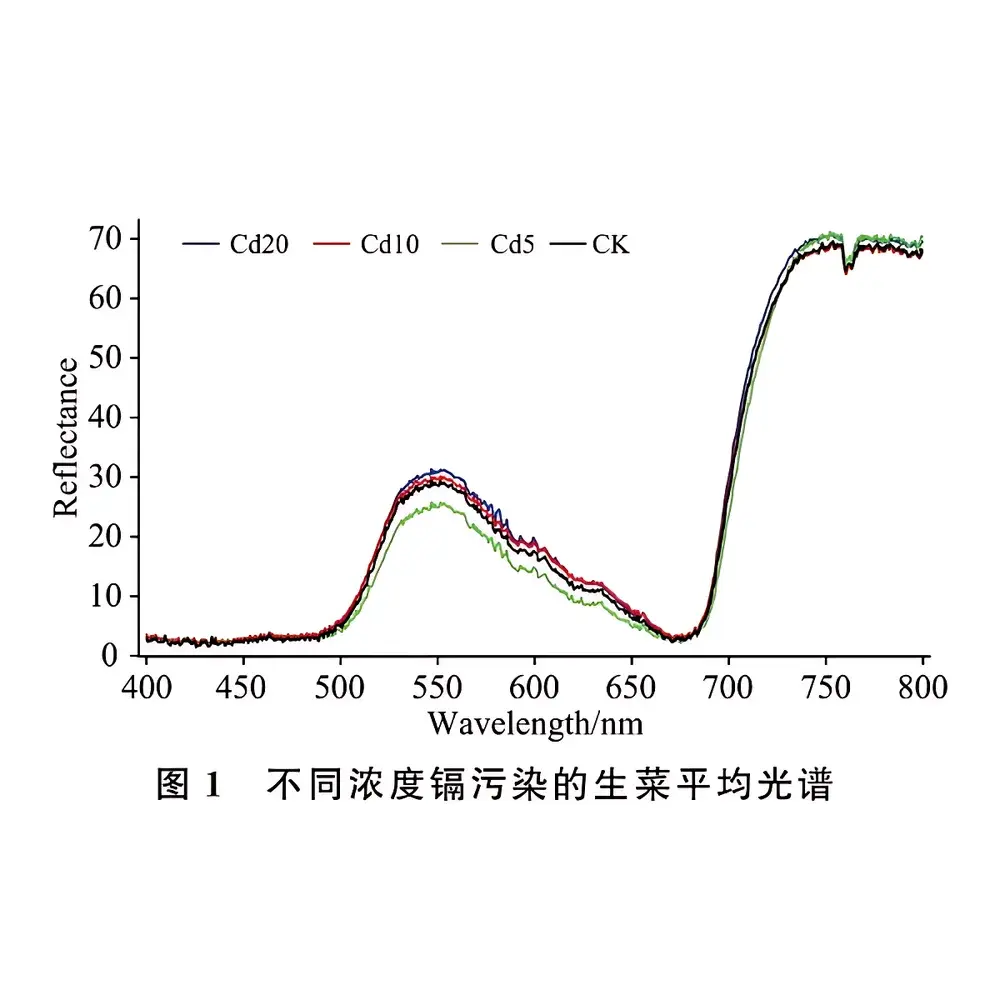
- Feature wavelength selection via Competitive Adaptive Reweighted Sampling (CARS) and Successive Projections Algorithm (SPA), targeting biologically relevant bands (e.g., 500–600 nm for chlorophyll-related absorption; 700–750 nm for structural water and cell integrity signatures)
- Multi-algorithm regression benchmarking: PLSR, SVR with RBF kernel, and shallow feedforward neural networks—each rigorously cross-validated (10-fold CV) and evaluated using R², RMSE, and residual prediction deviation (RPD)
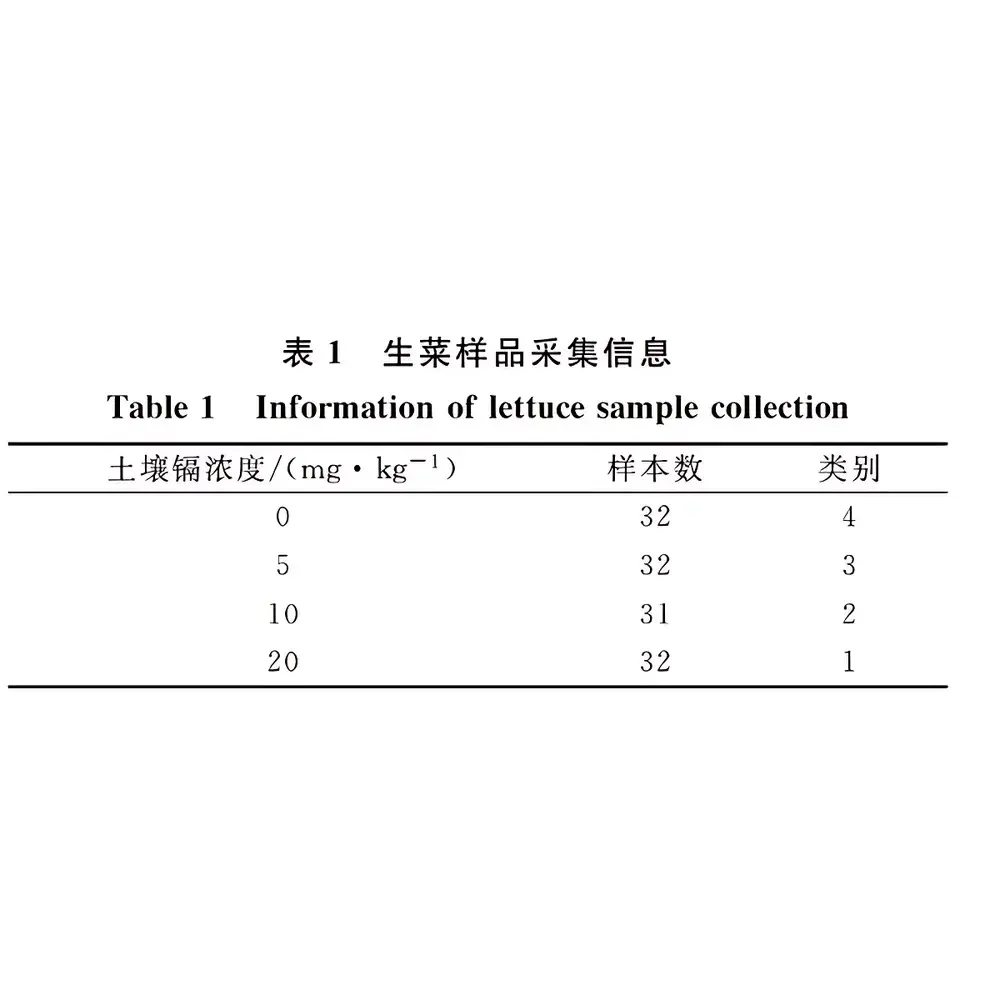
- Model validation performed across defined Cd concentration gradients (CK, Cd5, Cd10, Cd20 mg/kg dry weight), with documented sensitivity down to 0.8 mg/kg Cd in fresh tissue under controlled acquisition conditions
- Deliverables include full model documentation (preprocessing workflow, feature list, hyperparameters), calibration/validation set metadata, and Python-based inference script compatible with common spectral data formats (.jdx, .csv, .spc)
Sample Compatibility & Compliance
The modeling service is validated specifically for Lactuca sativa (butterhead and romaine cultivars) grown under hydroponic or standardized soil culture, harvested at rosette stage. Samples must be free of surface moisture, mechanical damage, or visible disease prior to spectral acquisition. While not a regulated medical device or GMP-grade instrument, the modeling framework adheres to principles outlined in ISO 18332:2018 (Spectroscopic analysis — Chemometric models for quantitative analysis) and supports traceability requirements aligned with GLP-compliant laboratories. All reference Cd concentrations are traceable to NIST SRM 1573a (Tomato Leaves) and certified through accredited third-party testing per ISO/IEC 17025. Model performance metrics comply with AOAC INTERNATIONAL guidelines for method validation in food safety applications.
Software & Data Management
The delivered model is implemented as a lightweight, dependency-minimized Python package (compatible with Python 3.8+), requiring only NumPy, SciPy, and scikit-learn. No proprietary runtime or license server is required. Input spectra are accepted in ASCII-delimited format with wavelength (nm) and reflectance (unitless) columns. Output includes predicted Cd concentration (mg/kg fresh weight), prediction uncertainty estimate (±RMSECV), and residual diagnostic plot. Raw spectral datasets and metadata are structured according to ISA-Tab v1.1 conventions to ensure interoperability with LIMS platforms and FAIR data principles. Audit trails for model training—including version-controlled preprocessing steps, random seed initialization, and CV fold assignments—are provided in machine-readable JSON logs, supporting 21 CFR Part 11–aligned record retention where applicable.
Applications
- Real-time quality assurance in vertical farms and greenhouse production units, enabling dynamic irrigation or nutrient solution adjustment based on early Cd accumulation signals
- Pre-market screening at packing houses to flag suspect batches prior to distribution, reducing recall risk and supporting HACCP plan implementation
- Research-grade support for phytoremediation studies, where non-destructive longitudinal monitoring of Cd uptake kinetics in living plants is essential
- Extension of the core modeling architecture to related leafy greens (spinach, kale) and other heavy metals (Pb, As) via transfer learning—available as follow-on service modules
- Integration with industrial hyperspectral imaging systems (e.g., line-scan cameras operating at 1–5 kHz frame rates) for spatially resolved contamination mapping across conveyor-belt–based sorting systems
FAQ
Is this a physical instrument or software-only deliverable?
This is a laboratory service delivering a fully documented, validated chemometric model—not hardware. Clients provide spectral data acquired on their own Vis-NIR system; ESEN develops, validates, and delivers the predictive model.
What reference method is used for Cd quantification during model calibration?
Inductively coupled plasma mass spectrometry (ICP-MS) following EPA Method 6020B, with detection limit ≤0.05 µg/L and recovery rates maintained between 92–105% across all calibration levels.
Can the model be retrained with my in-house spectral data?
Yes. Full source code, preprocessing scripts, and training notebooks are included. Re-training requires representative Cd reference data and adherence to the documented acquisition protocol (e.g., fixed probe distance, ambient light control, temperature-stabilized sample stage).
Does the service include hardware integration support?
Hardware integration (e.g., API development for OEM spectrometers, PLC communication protocols) is available as a separate engineering engagement, scoped and quoted upon technical review of the target platform.
How frequently should the model be re-validated in operational use?
Annual re-validation is recommended, or after major changes to cultivar, growth medium, or spectral acquisition setup. Drift monitoring via control sample runs (n ≥ 5 per shift) is advised for continuous operation.


