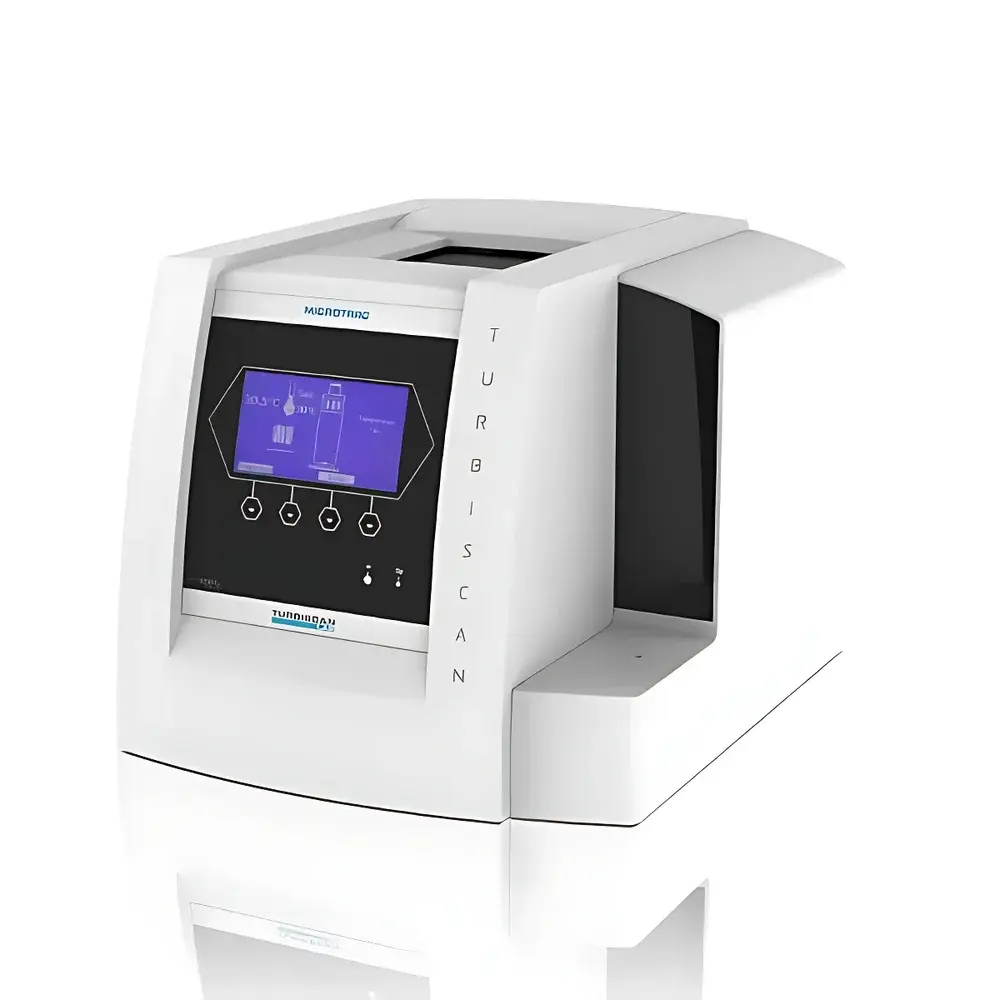
Formulaction TURBISCAN LAB Stability Analyzer
| Brand | Formulaction (Microtrac) |
|---|---|
| Origin | France |
| Model | TURBISCAN LAB |
| Light Source | 880 nm pulsed near-infrared LED |
| Measurement Principle | Multiple Light Scattering (MLS) |
| Particle Size Range | 0.01–1000 µm |
| Maximum Volume Concentration | up to 95% v/v |
| Temperature Control Range | RT + 5 °C to 60 °C |
| Temperature Accuracy | ±0.5 °C |
| Scan Height | 55 mm |
| Spatial Resolution | 20 µm |
| Dimensions (W × D × H) | 38 × 42 × 32 cm |
| Sample Capacity | 1 tube per run |
| Data Acquisition Modes | Full-height scanning (every 20 µm) or fixed-position kinetic monitoring |
Overview
The Formulaction TURBISCAN LAB Stability Analyzer is an industry-standard instrument engineered for non-invasive, quantitative characterization of physical instability in colloidal and dispersed systems. It operates on the principle of Multiple Light Scattering (MLS), a patented optical method that simultaneously measures both transmitted (T) and backscattered (BS) light intensities across the entire sample height—without dilution, agitation, or contact. Unlike conventional techniques such as centrifugation, visual assessment, or dynamic light scattering (DLS), MLS enables direct detection of concentration gradients and particle size evolution *in situ*, preserving native formulation conditions. The system employs a pulsed 880 nm near-infrared source, selected for optimal penetration through opaque, highly concentrated, or colored samples while minimizing interference from absorption or fluorescence. This wavelength ensures high signal-to-noise ratio and robustness against thermal drift, making it suitable for long-term stability studies under controlled temperature environments ranging from ambient +5 °C to 60 °C.
Key Features
- Non-destructive, label-free analysis: No sample preparation, dilution, or labeling required—maintains original dispersion state and interfacial integrity.
- Dual-channel optical detection: Independent synchronized measurement of transmitted and backscattered light at every 20 µm interval over a 55 mm scan height.
- High-resolution spatial profiling: Generates vertical “fingerprint” maps of local concentration (φ) and hydrodynamic diameter (dH)—enabling identification of creaming, sedimentation, flocculation, coalescence, and Ostwald ripening.
- Precise thermostatic control: Integrated Peltier-based temperature regulation with ±0.5 °C accuracy and programmable ramp profiles for accelerated stability testing per ICH Q1 guidelines.
- Flexible acquisition modes: Full-height scanning (programmable up to 250 cycles) or fixed-position kinetic monitoring (down to 1-second temporal resolution) for real-time tracking of particle migration velocity and structural evolution.
- Comprehensive instability quantification: Automated calculation of Turbiscan Stability Index (TSI), layer thickness, particle mobility, and dispersion degree—traceable to ISO 13321 and ASTM E2412 standards.
Sample Compatibility & Compliance
The TURBISCAN LAB accommodates a broad spectrum of pharmaceutical and biopharmaceutical formulations—including emulsions, suspensions, liposomes, protein aggregates, nanocrystals, and polymeric micelles—across volume concentrations from <0.01% to 95% v/v and particle sizes spanning 10 nm to 1 mm. Its NIR optics eliminate interference from pigment absorption and allow direct analysis of undiluted parenteral suspensions, topical gels, and oral liquid dosage forms. The instrument supports GLP-compliant workflows: audit-trail-enabled software logs all user actions, parameter changes, and raw data timestamps; export formats comply with FDA 21 CFR Part 11 requirements for electronic records and signatures. Method validation documentation aligns with USP , Ph. Eur. 2.9.37, and ICH Q5C recommendations for comparability and stability protocol design.
Software & Data Management
TURBISCAN’s proprietary software provides fully automated data processing, visualization, and reporting. Raw BS/T profiles are converted into quantitative metrics including local φ(z,t) and dH(z,t) distributions, time-resolved stratification kinetics, and TSI values calculated via root-mean-square deviation across the full scan profile. Users can define custom regions of interest (ROIs), apply smoothing filters, overlay multiple experiments, and generate comparative stability rankings. All datasets are stored in vendor-neutral HDF5 format with embedded metadata (instrument ID, calibration date, operator, SOP version). Export options include CSV, PDF reports with annotated graphs, and XML-compatible structured data for integration into LIMS or QMS platforms. Software updates follow a documented change control process compliant with ISO 13485 and GAMP5 classifications.
Applications
This analyzer serves critical roles in preformulation screening, formulation optimization, excipient compatibility assessment, and regulatory stability program execution. In early development, it rapidly identifies destabilizing mechanisms—e.g., surfactant depletion-induced coalescence in oil-in-water emulsions or pH-dependent aggregation in monoclonal antibody solutions. During process transfer, it validates equivalence between manufacturing sites by comparing TSI evolution profiles under identical stress conditions. For lifecycle management, it supports bracketing and matrixing strategies per ICH Q5E and provides objective evidence for shelf-life extension requests. Additional use cases include quality-by-design (QbD) element mapping, cleaning validation residue detection, and nanoparticle batch release testing where traditional methods lack sensitivity or reproducibility.
FAQ
How does MLS differ from dynamic light scattering (DLS)?
MLS measures static light intensity profiles across a macroscopic sample column to detect spatial heterogeneity and migration phenomena; DLS analyzes temporal fluctuations in scattered light from Brownian motion to infer average hydrodynamic size in dilute, homogeneous systems.
Can the TURBISCAN LAB analyze opaque or colored formulations?
Yes—the 880 nm NIR source minimizes absorption artifacts common with visible-light techniques, enabling reliable analysis of iron oxide suspensions, titanium dioxide emulsions, and dye-containing injectables without dilution.
Is temperature calibration traceable to national standards?
Yes—each unit ships with a NIST-traceable temperature verification certificate, and in-field calibration is supported using certified reference thermistors per ISO/IEC 17025 procedures.
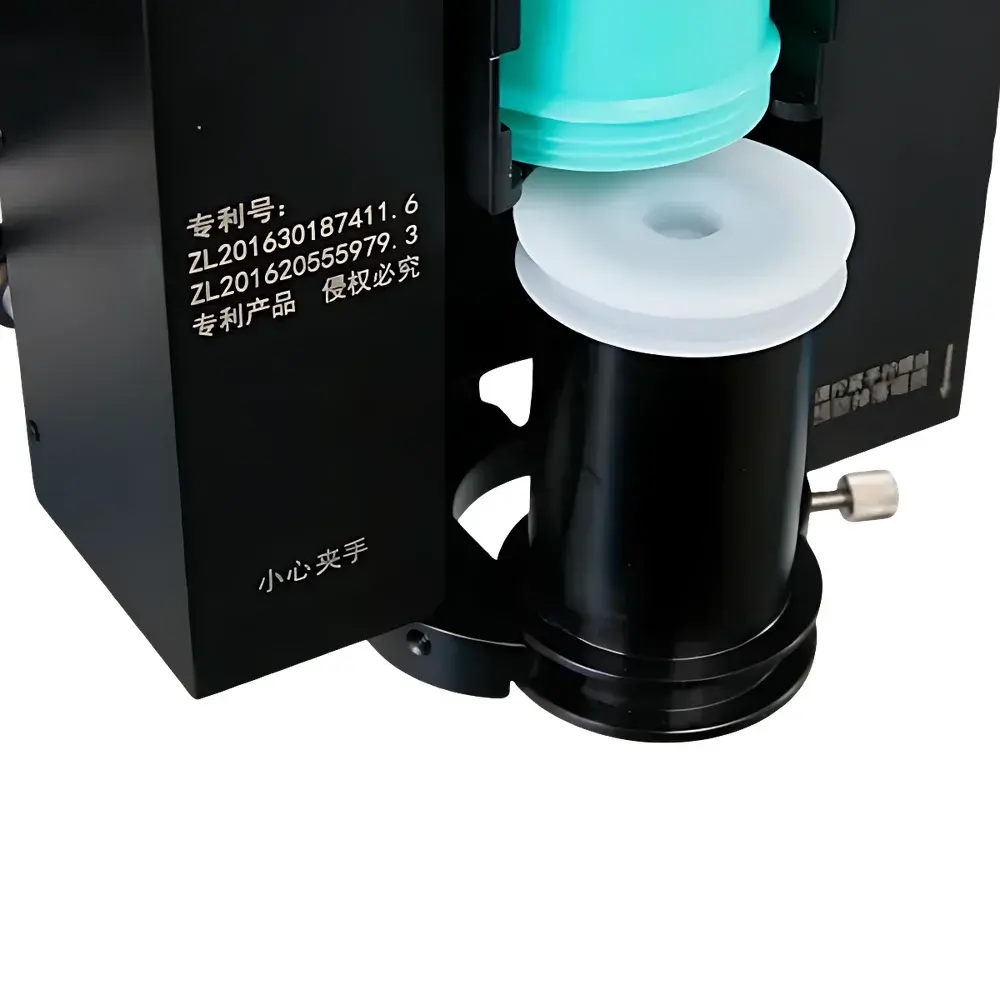
What sample containers are compatible?
Standard 10–25 mm diameter cylindrical glass or quartz tubes (10–50 mL volume); custom holders available for vials, syringes, or microfluidic chips upon request.
Does the software support multi-user permissions and electronic signatures?
Yes—role-based access control (RBAC), 21 CFR Part 11-compliant electronic signatures, and full audit trail generation are enabled by default in validated software configurations.