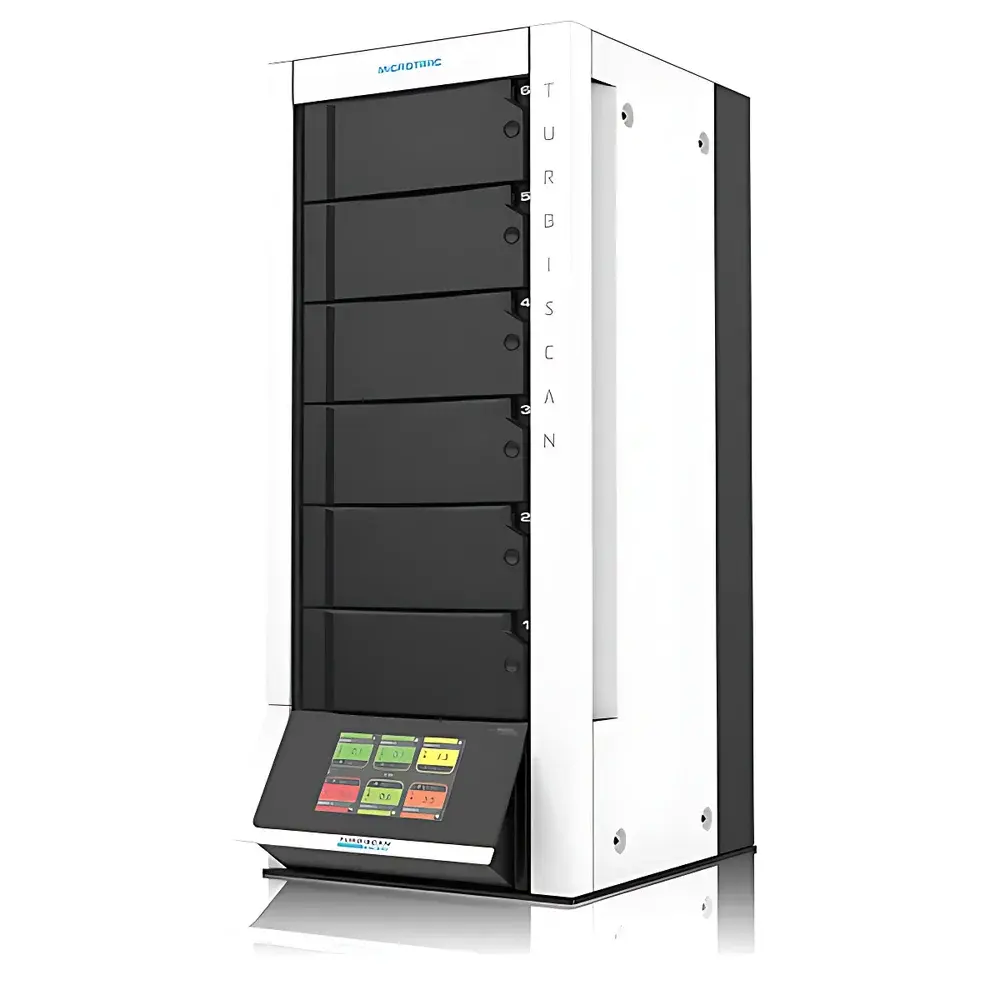
Formulaction TURBISCAN TOWER Stability Analyzer
| Brand | Formulaction (Microtrac) |
|---|---|
| Origin | France |
| Model | TURBISCAN TOWER |
| Light Source | 880 nm pulsed NIR LED |
| Measurement Principle | Multiple Light Scattering (MLS) |
| Particle Size Range | 0.01–1000 µm |
| Max. Volume Concentration | 95% v/v |
| Temperature Control Range | 4–80 °C |
| Temp. Accuracy | ±0.1 °C |
| Scan Height | 55 mm |
| Spatial Resolution | 20 µm |
| Scan Frequency | 1 scan per 20 s (at ambient) |
| Temp. Regulation Interval | Every 30 s |
| Max. Programmable Scan Steps | 250 |
| Sample Capacity | 6 positions |
| Dimensions (W×D×H) | 35 × 45 × 90 cm |
Overview
The Formulaction TURBISCAN TOWER Stability Analyzer is an advanced, non-invasive instrument engineered for real-time, quantitative physical stability assessment of colloidal and dispersed systems. It operates on the principle of Multiple Light Scattering (MLS), leveraging a pulsed 880 nm near-infrared light source to simultaneously measure both transmitted (T) and backscattered (BS) light intensities across the full height of a static sample tube. Unlike conventional techniques requiring dilution or sampling, MLS enables direct analysis of concentrated, opaque, or highly viscous formulations—including emulsions, suspensions, foams, gels, and pastes—without altering their native state. The system captures spatially resolved optical profiles along a 55 mm vertical scan range at 20 µm resolution, generating high-fidelity “stability fingerprints” that reflect changes in local particle/droplet concentration (φ) and hydrodynamic diameter (dH) over time. These profiles form the basis for detecting and quantifying key destabilization mechanisms: sedimentation, creaming, flocculation, coalescence, Ostwald ripening, and phase separation.
Key Features
- Non-destructive, label-free analysis requiring no sample dilution, centrifugation, or filtration
- Dual-detection architecture: synchronized transmission and backscatter photodiodes optimized for transparent to highly concentrated systems (up to 95% v/v)
- Precise thermostatic control from 4 °C to 80 °C with ±0.1 °C stability, enabling accelerated stability studies under ICH Q1A(R3)-compliant conditions
- Automated 6-position sample carousel supporting unattended multi-sample testing with programmable scan sequences (up to 250 steps)
- High-resolution spatial profiling: 2750 data points per scan (55 mm / 20 µm), capturing localized heterogeneity with micron-scale sensitivity
- Real-time kinetic monitoring: configurable scan intervals down to 20 seconds, with independent temperature regulation every 30 seconds
- Rugged optical design using a stable 880 nm NIR LED source—minimizing interference from color, fluorescence, or absorption typical of visible-light methods
Sample Compatibility & Compliance
The TURBISCAN TOWER accommodates a broad spectrum of pharmaceutical and biopharmaceutical formulations: oil-in-water and water-in-oil emulsions, nanoparticle suspensions (liposomes, polymeric NPs, inorganic colloids), protein aggregates, micellar solutions, hydrogels, and semi-solid dosage forms. Its measurement robustness across extreme concentrations and opacities supports formulation development, excipient screening, and comparability studies per ICH Q5C and Q5E guidelines. Data integrity meets regulatory expectations for GLP and GMP environments: audit-trail-enabled software logs all user actions, parameter modifications, and calibration events. While not inherently 21 CFR Part 11 compliant out-of-the-box, the system supports integration with validated LIMS or ELN platforms through secure CSV/Excel export and timestamped metadata embedding.
Software & Data Management
The dedicated TURBISCAN Analysis Software (v3.x or later) provides comprehensive post-processing and visualization tools. It computes six primary stability indicators: (1) BS and T intensity vs. time profiles; (2) layer thickness evolution (e.g., creaming front displacement); (3) particle migration velocity (µm/h); (4) hydrodynamic diameter (dH) and volume fraction (φ) kinetics; (5) mean free path (ℓ) and Turbiscan Stability Index (TSI); and (6) dispersion index—a dimensionless metric inversely correlated with solid dispersion homogeneity. All outputs are traceable, exportable, and support batch comparison, statistical trend analysis, and custom report generation. Raw scans are stored in proprietary .tsf format with embedded metadata (timestamp, temperature, position, operator ID), ensuring full experimental reproducibility.
Applications
- Accelerated stability testing of injectables, topical creams, oral suspensions, and inhalation aerosols per ICH Q1A(R3)
- Quantitative ranking of surfactant efficacy, polymer stabilizers, or viscosity modifiers
- Early detection of aggregation onset in monoclonal antibody formulations
- Optimization of lyophilization cycle parameters via pre- and post-reconstitution stability mapping
- Batch-to-batch consistency verification during tech transfer and scale-up
- Supporting QbD initiatives by linking material attributes (e.g., particle size distribution, zeta potential) to critical quality attributes (CQAs) such as phase separation rate
FAQ
Does the TURBISCAN TOWER require sample dilution before analysis?
No. Its MLS technology is specifically designed for undiluted, concentrated samples—eliminating artifacts introduced by dilution-induced aggregation or interfacial stress.
Can it distinguish between flocculation and coalescence?
Yes. Flocculation manifests as increased backscatter without significant change in transmission; coalescence produces concurrent increases in both BS and T due to droplet growth and reduced interfacial area.
Is temperature ramping supported?
The system maintains setpoint temperature with high precision but does not perform dynamic ramping; however, stepwise temperature protocols (e.g., 25 °C → 40 °C → 60 °C) can be programmed between scan sequences.
What sample tube formats are compatible?
Standard 10 mm or 14 mm outer diameter cylindrical glass or plastic tubes (height ≥ 60 mm); custom holders available for alternative geometries.
How is data validated for regulatory submissions?
Raw data files include embedded timestamps, instrument ID, calibration history, and environmental logs; validation packages (IQ/OQ/PQ) and 21 CFR Part 11 add-ons are available upon request through Formulaction’s global service network.