High-Resolution Planar Optode Fluorescence Imaging Analyzer – Easysensor Planar Optode Analyzer (Model 02)
| Brand | Easysensor |
|---|---|
| Origin | Jiangsu, China |
| Manufacturer Type | Authorized Distributor |
| Country of Origin | China |
| Model | Planar Optode Analyzer (Model 02) |
| Imaging Resolution | 5472 × 3678 pixels |
| Lens | 20 MP Color CCD |
| Excitation/Emission Range | 400–500 nm |
Overview
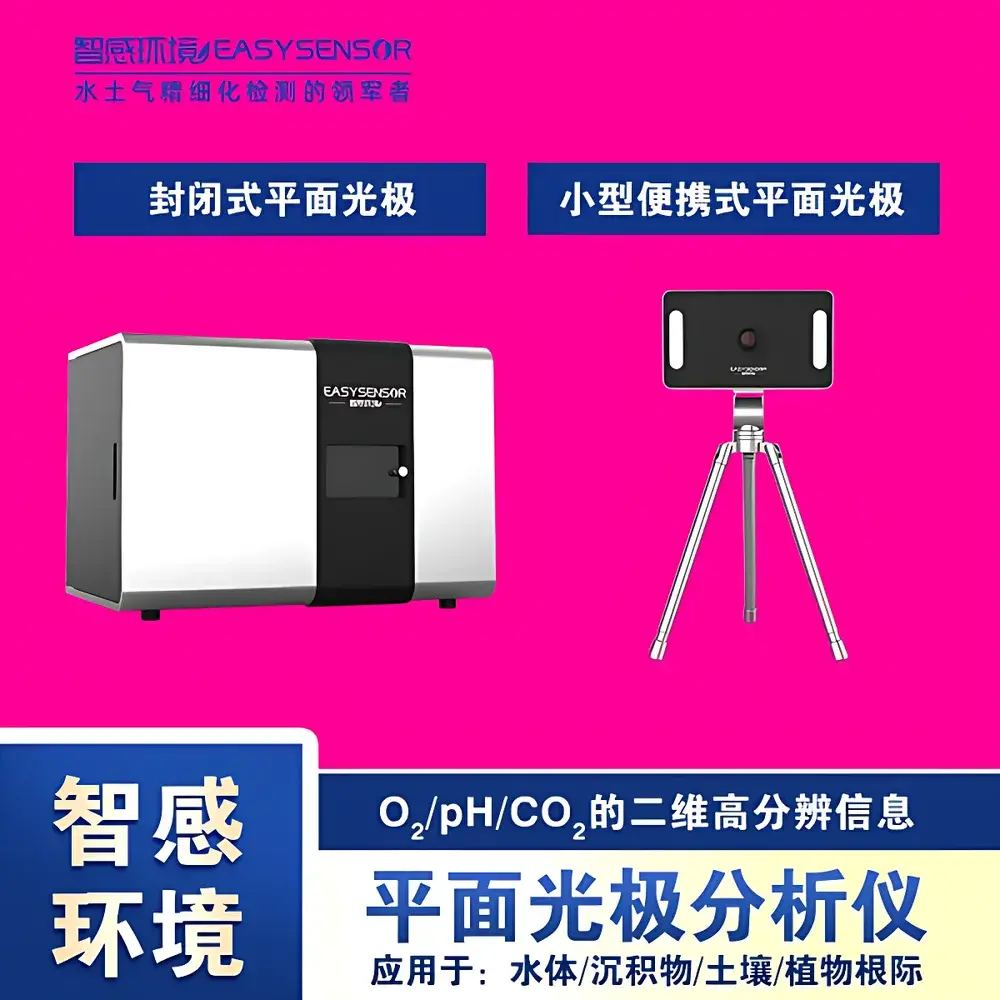
The Easysensor Planar Optode Analyzer (Model 02) is a research-grade optical imaging instrument engineered for quantitative, two-dimensional mapping of dissolved oxygen (O₂), pH, and carbon dioxide (CO₂) distributions in heterogeneous environmental matrices. It operates on the principle of planar optode sensing—combining thin-film optical chemistry with high-sensitivity fluorescence imaging. A chemically selective, polymer-embedded fluorophore layer is placed in direct contact with the sample surface (e.g., sediment-water interface, rhizosphere, or soil core). Upon excitation within the 400–500 nm spectral band, the embedded indicator dyes undergo concentration-dependent changes in fluorescence intensity or lifetime. These spatially resolved optical responses are captured by a calibrated 20-megapixel color CCD camera under controlled dark-field conditions, enabling pixel-wise quantification of analyte gradients across the imaged plane.
Key Features
- Sealed optical chamber design minimizes ambient light contamination and ensures stable illumination geometry during long-term time-series acquisitions.
- Non-invasive, in situ imaging capability for intact sediment cores, soil columns, plant root systems, and benthic biofilms—no physical sectioning or probe insertion required.
- Native spatial resolution of 5472 × 3678 pixels supports sub-millimeter mapping of chemical microgradients across areas up to 10 × 7 cm (dependent on lens focal length and working distance).
- Dual-mode fluorescence detection: intensity-based ratiometric analysis (e.g., red/green channel ratios for pH) and single-channel intensity calibration for O₂ and CO₂, compatible with Stern-Volmer and polynomial fitting protocols.
- Integrated hardware synchronization between LED excitation source, filter wheel (optional), and camera exposure timing to eliminate motion artifacts and ensure temporal fidelity in dynamic experiments.
Sample Compatibility & Compliance
The analyzer accommodates standard petri dishes (90 mm), custom acrylic flow cells, sediment core liners (up to 15 cm diameter), and rhizoboxes with transparent sidewalls. All optical components—including the excitation LED array and emission filters—are compliant with IEC 62471 (Photobiological Safety) standards. The system supports method validation per ISO 15197 (in vitro diagnostic devices) and ASTM D882-22 (optical sensor characterization) guidelines. Data acquisition workflows can be configured to meet GLP documentation requirements, including operator ID logging, timestamped image metadata, and audit-trail-enabled calibration history storage.
Software & Data Management
The proprietary Easysensor OptoView software (v3.2+) provides an integrated environment for hardware control, image acquisition, photometric calibration, and quantitative mapping. Key modules include: (i) multi-point intensity calibration using reference standards; (ii) automatic grid-based region-of-interest (ROI) segmentation; (iii) pixel-wise conversion of raw intensity values into concentration maps using user-defined calibration curves; (iv) export of TIFF/CSV/NetCDF files for downstream statistical analysis in MATLAB, Python (NumPy/Xarray), or R. Software architecture adheres to FDA 21 CFR Part 11 principles—supporting electronic signatures, role-based access control, and immutable data archiving.
Applications
This instrument is routinely deployed in biogeochemical research laboratories to characterize O₂ consumption zones in marine sediments, quantify pH shifts associated with nitrification/denitrification hotspots, and visualize CO₂ accumulation around root exudation sites. It supports experimental designs aligned with OECD Test Guideline 217 (sediment-water systems) and USGS Techniques and Methods Book 4, Chapter D3 (field-deployable sensor validation). Additional use cases include corrosion monitoring in confined aqueous environments, microbial fuel cell anode/cathode interface studies, and validation of reactive transport models (e.g., PHREEQC, ORCHESTRA) with spatially explicit boundary condition data.
FAQ
What types of optode membranes are supported?
The system is compatible with commercially available planar optodes from PreSens, PyroScience, and custom-synthesized films—provided they exhibit measurable fluorescence response within the 400–500 nm excitation window and emit detectable signal above camera read noise.
Can the system perform lifetime-based measurements?
No—this model relies exclusively on intensity-based quantification. Time-resolved fluorescence decay analysis requires pulsed excitation sources and TCSPC-capable detectors, which are not included in this configuration.
Is remote operation possible?
Yes—via Ethernet-connected PC with static IP assignment; full instrument control, real-time preview, and batch acquisition scheduling are supported through the OptoView Remote Client module.
How is temperature compensation handled?
Temperature sensors (PT100) may be mounted adjacent to the sample stage; recorded thermal data are automatically embedded in image metadata and can be applied as correction factors during post-processing using built-in polynomial compensation tools.
What is the minimum detectable concentration change for O₂?
Detection limit depends on membrane sensitivity and integration time; typical achievable resolution is ±0.5% air saturation (≈1.3 µmol L⁻¹ at 20 °C) with 30-second exposures and 2×2 binning.