LA-ICP-TOFMS Elemental Imaging Service for Geological Samples
| Brand | Chemlab Pro |
|---|---|
| Origin | Shanghai, China |
| Manufacturer Type | Authorized Distributor |
| Origin Category | Domestic |
| Model | LA-ICP-TOFMS Elemental Imaging (Geological Application) |
| Quotation | Upon Request |
| Service Experience | 3–5 Years |
| Sample Dimensions | ≤9 cm × 9 cm × 2.5 cm |
| Surface Requirement | Flat polished surface preferred |
| Matrix-Matched Standards Available | For silicates and carbonates only |
| Quantitative Capability | Quantitative imaging only with matrix-matched reference materials |
| Spatial Resolution | 50 µm |
| Pixel Count | 137,000 |
| Imaging Area | 15.7 mm × 12.6 mm |
| Acceptance Criteria | Clear, artifact-free elemental distribution maps |
Overview
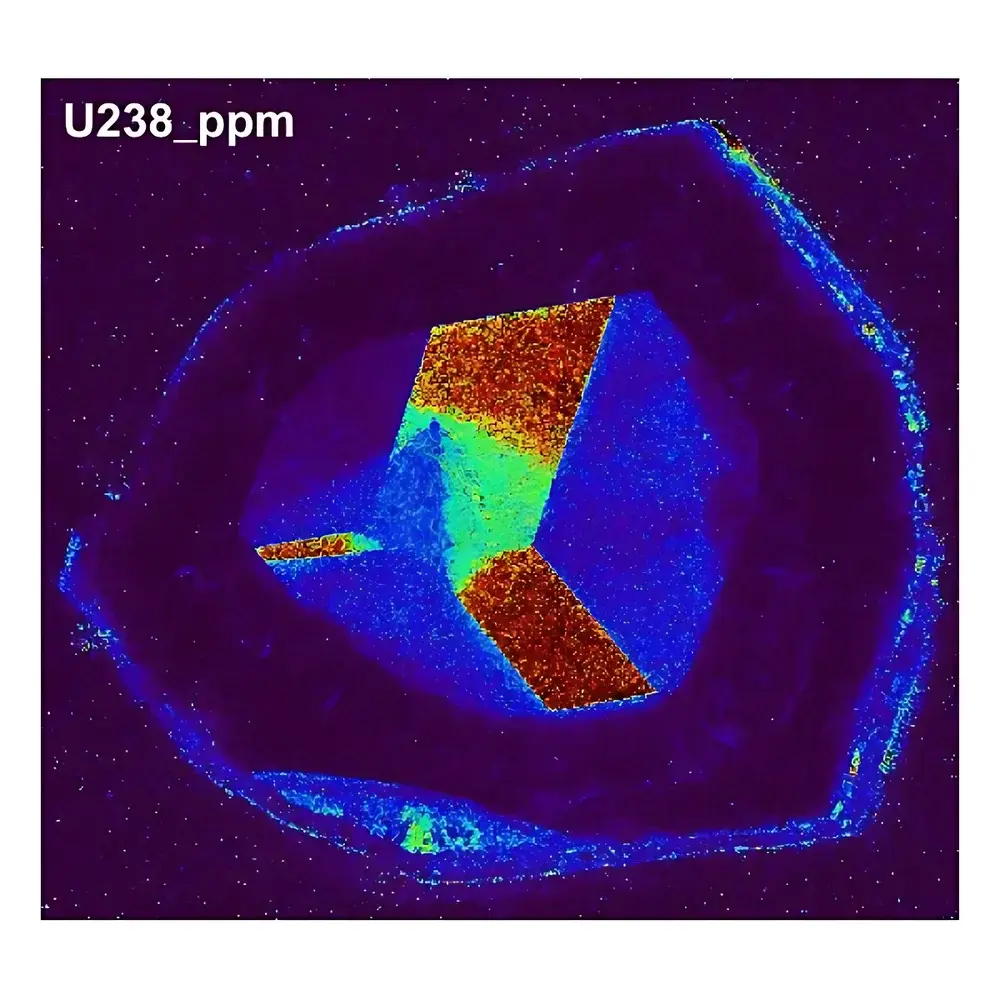
Chemlab Pro’s LA-ICP-TOFMS Elemental Imaging Service delivers high-fidelity, spatially resolved elemental distribution data for geological specimens using laser ablation inductively coupled plasma time-of-flight mass spectrometry. This technique combines pulsed UV laser sampling (typically 193 nm ArF excimer) with ultra-fast TOF mass analysis to acquire full-spectrum elemental data at each pixel—enabling simultaneous detection of isotopes from 7Li to 238U without mass scanning delays. Unlike quadrupole- or magnetic sector-based ICP-MS systems, the TOF architecture provides uniform sensitivity across the entire mass range and intrinsic multi-isotope correlation at microsecond temporal resolution—critical for resolving transient ablation signals from heterogeneous mineral phases. The service is engineered for precision geochemical mapping of igneous, metamorphic, and sedimentary samples—including zircons, garnets, feldspars, carbonates, and volcanic glasses—supporting petrogenetic modeling, provenance studies, fluid inclusion characterization, and diagenetic history reconstruction.
Key Features
- Sub-50 µm lateral spatial resolution achieved via optimized laser fluence, spot size control, and helium carrier gas tuning—ensuring minimal thermal diffusion and crater overlap.
- Full-mass-spectrum acquisition per pixel (137,000 total pixels over 15.7 × 12.6 mm area), enabling retrospective isotope ratio reprocessing without re-ablation.
- Dual-standard calibration strategy: NIST SRM 610/612 glass standards for broad-element coverage; matrix-matched reference materials (e.g., USGS GSD-1G, MPI-DING glasses) for quantitative accuracy in silicate and carbonate systems.
- Real-time signal monitoring with integrated ablation chamber pressure control, aerosol transport optimization, and plasma stability diagnostics to minimize oxide and doubly charged interferences.
- Robust architecture compliant with ISO/IEC 17025:2017 requirements for testing laboratories—covering method validation, uncertainty estimation, and traceability of calibration standards.
Sample Compatibility & Compliance
The service accepts polished thin sections, thick sections, and epoxy-mounted rock fragments meeting dimensional constraints (≤9 cm × 9 cm × 2.5 cm). Sample surfaces must be optically flat (Ra < 0.1 µm) and free of polishing residue or carbon coating. Non-conductive samples are analyzed under charge-compensation mode using low-energy electron flood. All analyses adhere to ASTM D7294–18 (Standard Guide for Laser Ablation Inductively Coupled Plasma Mass Spectrometry) and follow GLP-aligned documentation practices—including raw signal files (.raw), ablation parameters log, standardization reports, and certified reference material certificates. Data packages are structured for compatibility with IUGS-endorsed geochemical databases and support audit readiness for academic peer review or regulatory submissions.
Software & Data Management
Data acquisition and processing utilize industry-standard platforms including TOFWERK icpTOF Software v4.x for real-time spectral deconvolution and integration, and Iolite v4.5 for offline time-resolved data reduction, interference correction (e.g., 40Ar16O+ on 56Fe+), and isotope ratio calculation. Final deliverables include GeoTIFF-formatted elemental maps (16-bit), CSV-based pixel-intensity matrices, and PDF analytical reports containing detection limits (3σ of blank), relative standard deviation (RSD) of repeated standard measurements (<5% for major elements), and uncertainty propagation estimates per element. All datasets are archived for 5 years and provided with SHA-256 checksums to ensure integrity and reproducibility.
Applications
- Petrogenetic zoning analysis in zoned crystals (e.g., plagioclase, olivine) to reconstruct magmatic evolution and cooling histories.
- Trace element partitioning across mineral–melt boundaries during crystallization experiments.
- Diagenetic front mapping in carbonate reservoir rocks using redox-sensitive elements (e.g., Fe/Mn, U/Th).
- Micro-scale provenance fingerprinting of detrital minerals via rare earth element (REE) patterns and Hf–O isotope co-imaging.
- Fluid inclusion chemistry assessment through direct ablation of host mineral lattices adjacent to inclusions.
FAQ
What sample preparation is required prior to submission?
Polished thin or thick sections mounted on standard glass slides or aluminum stubs; surface roughness must not exceed Ra 0.1 µm. No conductive coating is permitted unless explicitly approved during pre-submission consultation.
Can quantitative results be generated for non-matrix-matched samples such as phosphates or sulfides?
Quantitative imaging requires matrix-matched standards. For non-matching matrices (e.g., apatite, pyrite), results are reported as semi-quantitative—normalized to internal standards (e.g., 29Si, 43Ca) with relative sensitivity factors derived from NIST glasses and documented uncertainty budgets.
Is depth profiling supported?
Yes—line-scan or depth-resolved rastering is available upon request, with vertical resolution dependent on ablation rate (typically 20–100 nm/pulse) and monitored via crater depth measurement using profilometry or SEM cross-sectioning.
How are detection limits determined for each element?
Method detection limits (MDLs) are calculated per element as 3× standard deviation of ≥10 blank measurements (laser-off background + procedural blank), acquired under identical ablation and plasma conditions used for sample analysis.
Are raw data files included in the final report?
Yes—complete .raw TOF spectra, ablation parameter logs, and processed .csv pixel matrices are delivered alongside the analytical report in a secure encrypted archive.