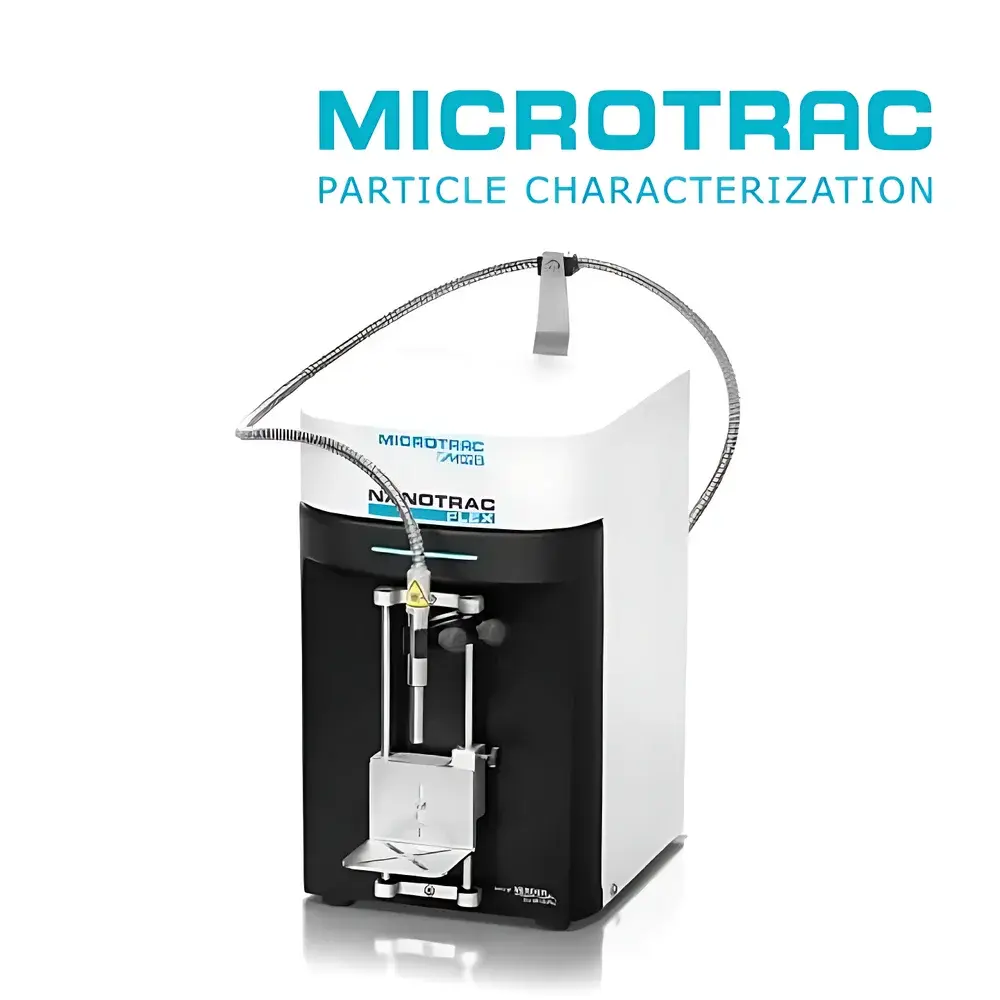
Microtrac NANOTRAC FLEX Dynamic Light Scattering Nanoparticle Size Analyzer
| Brand | Microtrac |
|---|---|
| Origin | Germany |
| Model | NANOTRAC FLEX |
| Particle Size Range | 0.3 nm – 10 µm |
| Size Reproducibility | ≤1% RSD |
| Temperature Control Range | 10–35 °C |
| Temperature Stability | ±0.1 °C (with optional Peltier module) |
| Detection Method | Dynamic Light Backscattering (180° geometry) with full-range Mie theory-based data inversion |
| Sample Volume | as low as 2 µL |
| Sample Concentration Limit | up to 40 vol.% (non-dilutive measurement) |
| Zeta Potential Range | –3000 mV to +3000 mV (when coupled with STABINO ZETA) |
| Molecular Weight Estimation | via hydrodynamic diameter and Debye plot correlation |
| Optical Architecture | Fixed-focal-length fiber-optic probe with laser amplification detection |
| Data Processing Algorithm | Frequency Power Spectrum (FPS), not conventional Photon Correlation Spectroscopy (PCS) |
Overview
The Microtrac NANOTRAC FLEX is a benchtop dynamic light scattering (DLS) nanoparticle size analyzer engineered for precision, flexibility, and operational robustness in both R&D and quality control environments. Unlike conventional DLS instruments relying on static cuvette-based optical cells and classical photon correlation spectroscopy (PCS), the NANOTRAC FLEX implements a patented external fiber-optic probe architecture operating at 180° backscatter geometry. This configuration enables true in situ and online particle sizing without sample transfer, cuvettes, or consumables. The system employs laser amplification detection—enhancing signal-to-noise ratio across low-scattering and high-concentration dispersions—and processes raw intensity fluctuations using Frequency Power Spectrum (FPS) analysis. FPS delivers superior resolution for polydisperse systems and eliminates the autocorrelation artifacts inherent in PCS, particularly under non-ideal scattering conditions. Coupled with full-range Mie theory modeling, the instrument provides rigorously physics-based particle size distributions from 0.3 nm to 10 µm in hydrodynamic diameter, applicable to colloids, proteins, liposomes, polymer nanoparticles, and industrial suspensions.
Key Features
- Modular fiber-optic probe design enabling direct immersion into any container—from microcentrifuge tubes (1.5 mL Eppendorf® compatible) to reactors and process lines
- No cuvettes, no alignment, no optical path recalibration: measurement setup time reduced to <30 seconds
- FlowGuard probe cap accessory for real-time DLS in stirred or flowing systems—suppresses turbulent interference while maintaining representative sample exchange at the sensing interface
- Minimal sample requirement: as low as 2 µL, ideal for precious biologics or synthetic intermediates
- Wide concentration tolerance: quantitative sizing up to 40 vol.% solids without dilution, validated per ISO 22412:2017 Annex C for concentrated systems
- Integrated temperature control (10–35 °C) with ±0.1 °C stability (Peltier option), supporting thermal stability studies and accelerated aging protocols
- FPS algorithm certified for multimodal distribution resolution, compliant with ASTM E2490–22 guidelines for DLS method validation
Sample Compatibility & Compliance
The NANOTRAC FLEX accommodates aqueous, organic, and mixed-solvent dispersions—including acetone, ethanol, THF, DMF, and chloroform—without optical window fouling or refractive index mismatch penalties. Its probe surface is chemically inert (316 stainless steel + sapphire window), resistant to corrosion and abrasion. For regulated environments, the system supports audit-trail-enabled operation when paired with Microtrac’s TRU software (21 CFR Part 11 compliant with electronic signatures, user role management, and immutable data logs). All size distribution outputs conform to ISO 9276-2:2019 (representation of particle size analysis results) and are traceable to NIST-traceable latex standards (e.g., NIST SRM 1963). Zeta potential extension via STABINO ZETA integration meets ISO 13099-1:2022 requirements for electrophoretic mobility measurement.
Software & Data Management
TRU Software v4.x provides intuitive workflow-driven operation: automated measurement sequence definition, real-time FPS spectrum visualization, batch processing with customizable pass/fail criteria, and export to CSV, PDF, or LIMS-ready XML. Advanced modules include pH/polyelectrolyte/salt titration scripting for colloidal stability mapping, Debye-Hückel fitting for ionic strength dependence, and overlay comparison of up to 16 distributions with statistical significance testing (ANOVA/Tukey HSD). Raw data files retain full temporal intensity traces, enabling retrospective reanalysis with updated optical models or regularization parameters—critical for GLP/GMP investigations and regulatory submissions.
Applications
- Biopharmaceutical development: aggregation kinetics of monoclonal antibodies, PEGylated proteins, and mRNA-LNPs under thermal or mechanical stress
- Materials science: nucleation/growth monitoring in sol-gel synthesis, metal oxide nanoparticle precipitation, and MOF crystallization
- Coatings & inks: dispersion stability assessment across pH, ionic strength, and surfactant concentration gradients
- Food & cosmetics: emulsion droplet coalescence, starch granule swelling, and nanocellulose network formation
- Quality assurance: release testing of nanosuspension drug products per USP and Ph. Eur. 2.9.31
FAQ
Can the NANOTRAC FLEX measure particles in opaque or highly turbid samples?
Yes—the 180° backscatter geometry and laser amplification detection allow reliable sizing in samples with optical densities exceeding OD600 = 5.0, provided Brownian motion remains detectable.
Is calibration required before each measurement?
No—factory-calibrated optics and embedded reference standards eliminate daily recalibration; only periodic verification using NIST-traceable standards is recommended per ISO/IEC 17025.
How does FPS differ from traditional PCS in resolving bimodal distributions?
FPS directly analyzes frequency-domain power spectra of intensity fluctuations, avoiding autocorrelation decay assumptions; it resolves peaks separated by 90% confidence, whereas PCS often merges closely spaced modes.
Can Zeta potential be measured simultaneously with size?
Not concurrently—but seamless hardware/software integration with STABINO ZETA enables sequential, same-sample measurements within minutes, preserving identical dispersion state and environmental conditions.
What maintenance is required for long-term reliability?
Annual optical inspection and probe tip cleaning with IPA/ultrasonication; no laser replacement or alignment needed within 10,000 hours of operation (rated lifetime).


