PhenoTron® PTS Plant Phenotyping Imaging System
| Brand | — |
|---|---|
| Origin | Beijing, China |
| Manufacturer Type | Authorized Distributor |
| Region of Manufacture | Domestic (PRC) |
| Model | PhenoTron® PTS |
| Pricing | Upon Request |
Overview
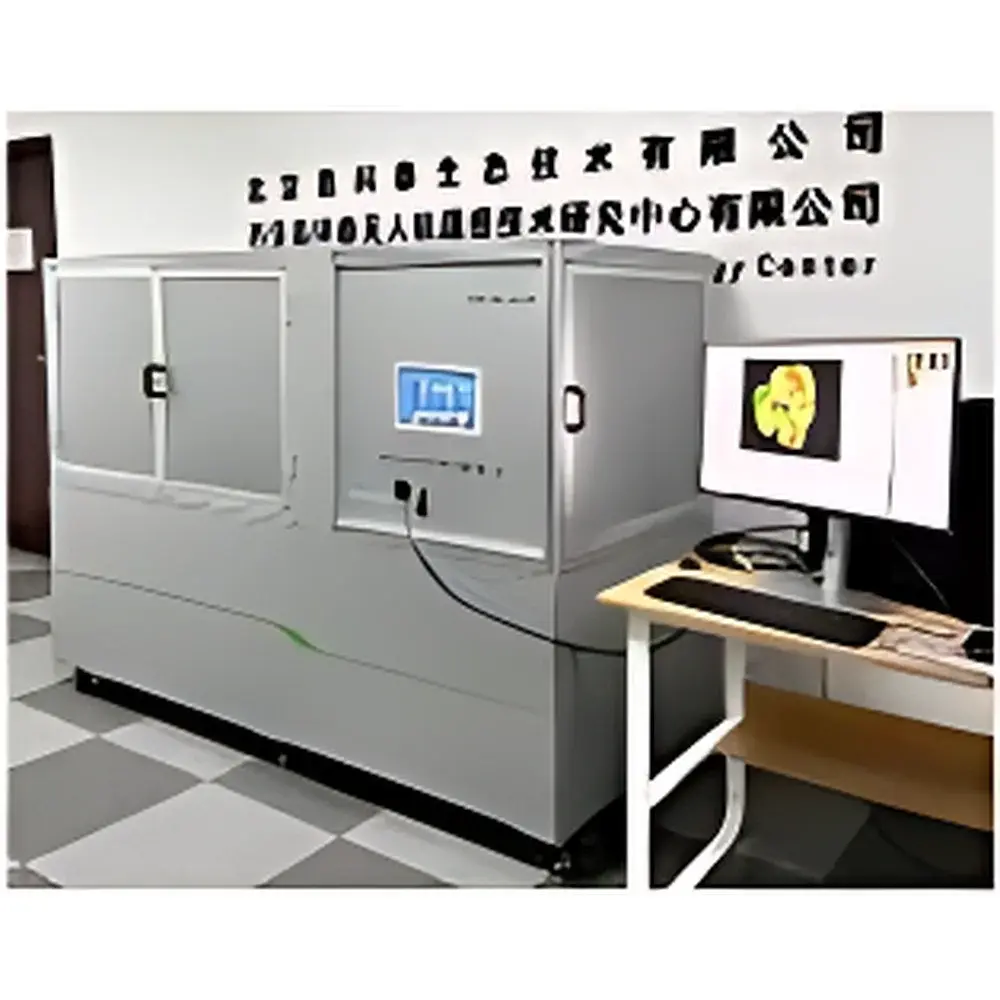
The PhenoTron® PTS Plant Phenotyping Imaging System is a modular, high-throughput, non-destructive phenomics platform engineered for quantitative, multi-modal imaging of plant and algal specimens across developmental stages—from seed germination and root architecture to mature leaves, fruits, and whole canopies. At its core, the system implements a patented Plant-to-Sensor (PTS) automated conveyance architecture, integrating synchronized optical measurement modalities grounded in fundamental biophysical principles: chlorophyll fluorescence kinetics (based on photosystem II photochemistry), VNIR/SWIR hyperspectral reflectance (400–1000 nm, extendable to 2500 nm), multispectral fluorescence emission profiling (F440–F740), thermal infrared radiometry (7.5–13.5 µm), and high-resolution RGB macro/micro imaging. This multi-sensor fusion enables simultaneous acquisition of complementary physiological, biochemical, structural, and thermoregulatory traits—providing orthogonal data streams essential for robust genotype–phenotype association studies under controlled or semi-controlled environments.
Key Features
- PTS Conveyance Platform: SpectraScan© precision motorized XYZ stage with sub-millimeter positional repeatability (<1 mm), programmable scan area ≥1200 × 300 mm (X–Y), Z-axis travel up to 400 mm; supports unattended cyclic scanning across multiple imaging stations.
- Modular Sensor Integration: Standard configuration includes VNIR hyperspectral imager (224 bands, FWHM 5.5 nm), FluorCam chlorophyll fluorescence imager (1360 × 1024 px CCD, 16-bit A/D, 20 fps), and multispectral fluorescence imager (7-position filter wheel, excitation-selectable UV–red LEDs).
- Programmable Illumination: Symmetric full-spectrum LED light source with 0–100% linear intensity control, adjustable height/angle, and stray-light isolation enclosure; supports regulated photobiological growth conditions and calibrated actinic illumination (up to 3000 µmol·m⁻²·s⁻¹ PAR, saturating pulse up to 6000 µmol·m⁻²·s⁻¹).
- Multi-Excitation Capability: Integrated LED array with selectable wavelengths (365/385 nm UV, 447/470/530/505/627/660/590/740 nm) enables targeted excitation of secondary metabolites (e.g., flavonoids, anthocyanins), GFP/YFP reporters, or luciferase activity.
- Automated Protocol Execution: Supports up to 10 user-defined experimental workflows; scheduled execution (e.g., diurnal Kautsky induction + nocturnal NPQ analysis); position memory, one-click save/load/delete; remote GUI access via Windows-based PC software with embedded 10-inch touchscreen interface.
Sample Compatibility & Compliance
The PhenoTron® PTS accommodates diverse biological samples without physical contact or tissue disruption: intact seedlings (Arabidopsis, lettuce, wheat), detached leaves, fruit/vegetable organs, germinating seeds, hydroponic or agar-grown roots, and microalgal cultures in Petri dishes or multi-well plates. Its design aligns with GLP-compliant phenotyping practices—data provenance is maintained through timestamped metadata embedding, hardware-triggered synchronization between sensors, and audit-ready log files. While not certified to ISO/IEC 17025, the system supports traceable calibration protocols (e.g., NIST-traceable temperature references for IR modules, spectral irradiance standards for LED sources) and facilitates compliance with FAO/CGIAR crop phenotyping guidelines and EU-funded initiatives such as EPPN2020.
Software & Data Management
The proprietary PhenoStudio™ software suite provides an integrated environment for acquisition, preprocessing, quantitative trait extraction, and statistical visualization. Each imaging modality operates within a unified workflow framework featuring Live preview, Protocol editor (drag-and-drop parameter sequencing), Pre-processing (flat-field correction, motion compensation, spectral unmixing), and Result quantification modules. Chlorophyll fluorescence analysis includes automated calculation of >50 parameters (Fv/Fm, Y(II), NPQ, qP, Rfd, ETR) with spatial mapping, temporal curve fitting, and histogram distribution. Hyperspectral data undergoes PLSR, PCA, and spectral index derivation (NDVI, PRI, ANTH, CIred-edge, etc.) yielding >90 biochemical/physiological proxies. Thermal images support region-of-interest (ROI) statistics, isotherm overlays, and time-series ΔT profiling. All outputs are exportable in HDF5, TIFF, CSV, and MAT formats—compatible with downstream platforms including R, Python (scikit-learn, h5py), and commercial tools like MATLAB or ENVI.
Applications
- Crop phenotyping for QTL mapping and genomic selection (e.g., salinity tolerance in wheat, Fusarium resistance in barley)
- High-throughput screening of germplasm collections for stress resilience (drought, heat, pathogen challenge)
- Functional validation of gene-editing outcomes via spatiotemporal fluorescence dynamics
- Post-harvest quality assessment of fruits and vegetables using reflectance indices and thermal heterogeneity metrics
- Algal biotechnology: monitoring photosynthetic efficiency, lipid accumulation, and oxidative stress responses
- Photobiology research: action spectrum determination, non-photochemical quenching kinetics, and circadian rhythm tracking
- Root phenomics: combining top-view RGB/macro-imaging with rhizobox-compatible thermal or fluorescence contrast
FAQ
What sample throughput can be achieved with the PhenoTron® PTS?
Typical throughput ranges from 50–200 plants per hour depending on imaging configuration and protocol complexity; fully automated overnight runs support longitudinal studies across multiple days.
Is the system compatible with growth chamber or greenhouse integration?
Yes—the PTS chassis is designed for climate-controlled room installation; optional environmental sensor inputs (RH, CO₂, ambient T) can be logged synchronously with imaging data.
Can raw hyperspectral data be exported for custom spectral modeling?
Yes—full-cube data (x, y, λ) is stored in open-format HDF5 with wavelength calibration metadata, enabling third-party spectral library development and machine learning model training.
Does the system support FDA 21 CFR Part 11 compliance for regulated research?
While not pre-certified, the software architecture supports electronic signatures, audit trails, and role-based access control—custom validation packages are available upon request for GxP environments.
What maintenance is required for long-term operational stability?
Annual recalibration of spectral response (hyperspectral module), LED irradiance output verification, and mechanical alignment checks of the PTS stage are recommended; all procedures are documented in the technical service manual.