PSI PlantScan Automated Multi-Spectral 3D Phenotyping Chamber
| Brand | PSI (Czech Republic) |
|---|---|
| Origin | Czech Republic |
| Model | PlantScan |
| Import Status | Imported |
| Type | Automated Plant Phenotyping System with Chlorophyll Fluorescence, RGB 3D, Thermal, NIR, and Hyperspectral Imaging |
Overview
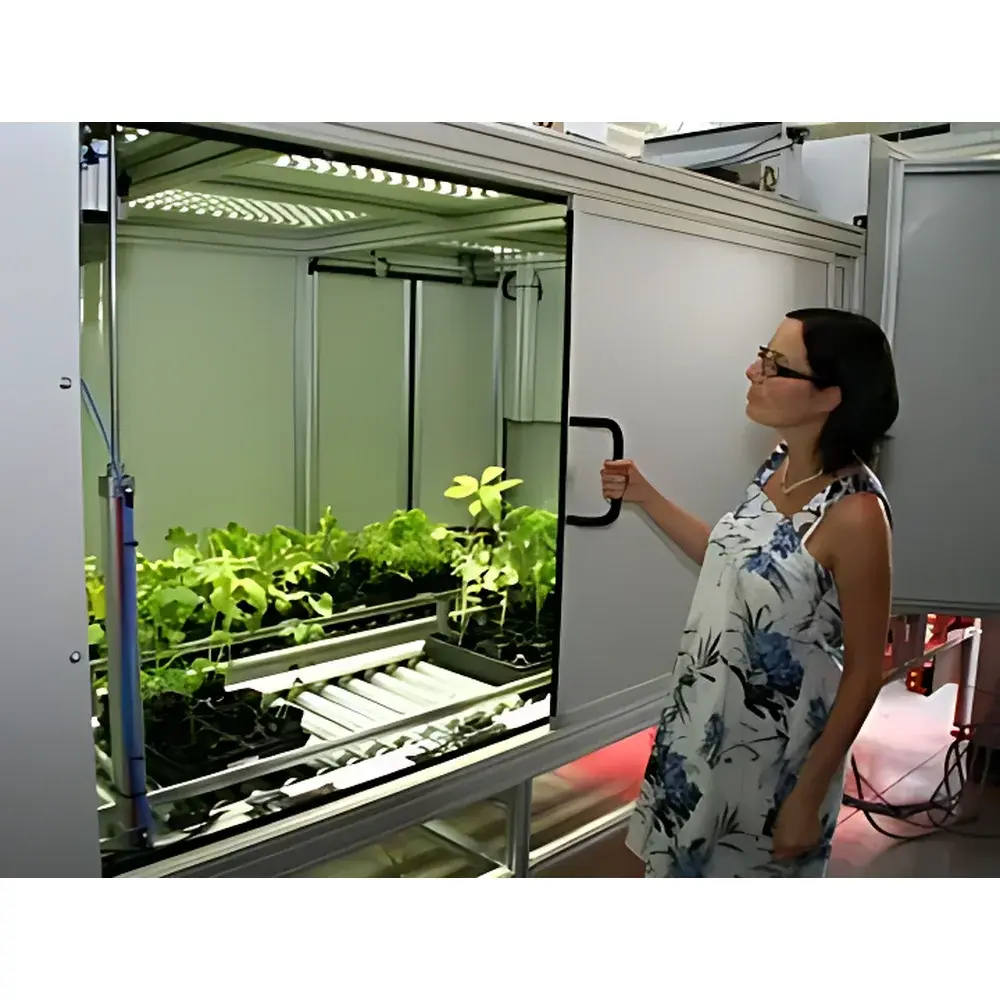
The PSI PlantScan Automated Multi-Spectral 3D Phenotyping Chamber is an integrated high-throughput plant phenomics platform engineered for non-invasive, longitudinal, and multi-parametric assessment of plant structure, physiology, and stress responses under tightly controlled environmental conditions. Based on a modular conveyor-based architecture, the system combines synchronized acquisition across six complementary imaging modalities: pulse-amplitude modulated (PAM) chlorophyll fluorescence imaging, high-resolution RGB true-color 3D surface reconstruction, uncooled microbolometer-based thermal infrared (TIR) imaging, near-infrared (NIR) reflectance imaging (700–1000 nm), hyperspectral imaging (400–1000 nm, configurable spectral resolution), and optional time-of-flight (ToF) depth mapping. Each imaging station operates within a fully regulated growth chamber environment—capable of independent control of photosynthetic photon flux density (PPFD), air temperature (±0.3 °C), relative humidity (±2% RH), CO₂ (200–2000 ppm), O₂ (5–21%), irrigation volume, and substrate moisture—ensuring experimental reproducibility across days, weeks, or entire life cycles. Designed for scalable deployment—from Arabidopsis thaliana rosettes to mature cereal canopies—the PlantScan enables quantitative trait locus (QTL) mapping, functional genomics validation, and pre-breeding selection under biotic and abiotic stress regimes.
Key Features
- Automated sample handling via programmable conveyor with barcode/RFID tracking for unambiguous plant identity and metadata linkage
- Dual-resolution imaging zones: 13 × 13 cm (high-magnification fluorescence & spectral analysis) and 35 × 40 cm (whole-plant 3D morphology and canopy-level thermal profiling)
- LED illumination modules with spectrally tunable output (365–940 nm), including far-red (730 nm) for phytochrome activation and thermal stimulation in TIR mode
- Integrated gravimetric irrigation and weighing system (±0.1 g precision) enabling real-time water-use efficiency (WUE) calculation and drought response kinetics
- Simultaneous acquisition of >50 standardized chlorophyll fluorescence parameters per pixel—including Fv/Fm, ΦPSII, NPQ, qP, ETR, and RFd—calculated using standardized JIP-test and OJIP protocols
- True-color 3D surface reconstruction via structured-light stereo photogrammetry, delivering sub-millimeter geometric fidelity and volumetric biomass estimation
- Thermal imaging at 640 × 480 resolution (NETD < 50 mK), calibrated against NIST-traceable blackbody references for absolute temperature mapping
- Hyperspectral data cubes acquired with push-broom scanning and onboard radiometric calibration; compatible with ENVI, Python (scikit-image, hylite), and MATLAB workflows
Sample Compatibility & Compliance
The PlantScan accommodates a broad spectrum of plant forms and developmental stages: seedlings (e.g., Arabidopsis, tomato, barley), vegetative rosettes, flowering individuals, and small canopy plants (up to 60 cm height). Growth trays are standardized to ISO 8601-compliant dimensions (e.g., 128 × 86 mm, 170 × 120 mm) and compatible with common soilless substrates (rockwool, peat plugs, hydroponic rafts). All hardware and software components comply with CE marking requirements for laboratory equipment (2014/30/EU EMC Directive, 2014/35/EU LVD). Data acquisition and storage adhere to FAIR principles (Findable, Accessible, Interoperable, Reusable); raw image datasets are saved in vendor-neutral HDF5 format with embedded EXIF-like metadata (timestamp, sensor ID, exposure, environmental setpoints). Audit trails for instrument configuration changes, user logins, and measurement execution are maintained in accordance with GLP-compliant record-keeping standards.
Software & Data Management
The PSI Phenotyper Suite v5.x provides unified control of mechanical subsystems, environmental actuators, and all imaging modalities through a Qt-based GUI. Experimental protocols—including dark adaptation duration, light induction sequences, irrigation schedules, and imaging frequency—are defined via drag-and-drop workflow editor or Python scripting interface. Batch processing pipelines support automated ROI definition (using k-means clustering or U-Net-derived segmentation models), pixel-wise parameter extraction, and statistical aggregation across treatment groups. Fluorescence decay kinetics are fitted using nonlinear least-squares algorithms (Levenberg–Marquardt), while thermal and NIR reflectance data undergo atmospheric correction and vegetation index computation (e.g., NDVI, PRI, WI). All processed results—including TIFF stacks, CSV tables, and interactive HTML reports—are archived in a PostgreSQL-backed database with role-based access control and optional integration with institutional LIMS platforms. Export formats include MIAME-compliant MIAPE-Plant Phenotype XML schemas and ISA-Tab templates for public repository submission (e.g., Phenome Network, EGA).
Applications
- High-throughput screening of photosynthetic efficiency and photoprotective capacity under controlled drought, salinity, heat, or heavy metal stress
- Quantitative phenotyping of stomatal conductance heterogeneity via thermal-NIR fusion analysis
- In vivo detection of pathogen-induced metabolic shifts using hyperspectral fingerprinting of leaf epidermal chemistry
- Longitudinal monitoring of nitrogen status via chlorophyll fluorescence yield (Fv/Fm) and NIR-based nitrogen absorption indices (NAI)
- Root-shoot coordination studies enabled by synchronized aboveground RGB-3D and belowground NIR transmittance imaging (with transparent rhizoboxes)
- Eco-toxicological assessment of herbicide mode-of-action through spatiotemporal dynamics of PSII inhibition and membrane integrity loss (thermal + fluorescence coupling)
- Microbiome–host interaction phenotyping via differential fluorescence quenching patterns in gnotobiotic systems
FAQ
What environmental parameters are independently controllable within the PlantScan chamber?
Air temperature, relative humidity, CO₂ and O₂ partial pressures, PPFD (spectral composition and intensity), irrigation volume/timing, and substrate moisture—all adjustable via the Phenotyper Suite with closed-loop feedback from onboard sensors.
Is the system compliant with regulatory data integrity standards such as FDA 21 CFR Part 11?
While the PlantScan itself is not a GxP-certified device, its software supports electronic signatures, audit trails, and secure user authentication—enabling implementation of Part 11–aligned SOPs when deployed in regulated environments.
Can the system be extended to include root imaging or soil moisture profiling?
Yes. Optional add-ons include NIR-transmission rhizobox modules, time-domain reflectometry (TDR) probes for volumetric water content, and laser-induced breakdown spectroscopy (LIBS) for elemental mapping.
What is the spatial resolution of the chlorophyll fluorescence imaging module?
At the standard 13 × 13 cm field of view, the system achieves ~100 µm/pixel resolution with 12-bit dynamic range and <1% inter-frame intensity drift over 8-hour acquisitions.
How does the system handle dark adaptation requirements for fluorescence measurements?
Plants are automatically conveyed into a dedicated dark-adaptation tunnel (≥30 min, LED-blocked, ambient temperature stabilized) prior to fluorescence imaging; timing and duration are fully programmable per experiment.