PSI PlantScreen Field-Based High-Throughput Plant Phenotyping Platform
| Brand | PSI |
|---|---|
| Origin | Czech Republic |
| Model | PlantScreen Field |
| Key Features | Integrated chlorophyll fluorescence imaging (Fo, Fm, Fv/Fm, ΦPSII, NPQ, qP, qN, Rfd), RGB phenotyping (5 Mpx, leaf area, solidity, eccentricity, roundness, NDVI-equivalent greenness), thermal imaging (640×480 px, 7.5–13 µm, −20 to 120 °C), hyperspectral imaging (380–1000 nm, 675 bands), LiDAR 3D structural scanning, GPS-guided autonomous mobile platform (12 m arm span, 10 m swath, 2 cm positional accuracy), real-time data acquisition & cloud-enabled phenomics database (MySQL), daylight-adapted fluorometry with modulated 620 nm pulse light and 735 nm far-red actinic light, 720×560 px CCD (50 fps, 12-bit) or optional 1360×1024 px (20 fps, 16-bit), 35×35 cm standard imaging field (customizable to 80×80 cm) |
| Compliance | Designed for GLP-aligned field trials, supports ISO 22029 (plant phenotyping terminology), ASTM E2912 (spectral reflectance standards), and FAO/CGIAR phenotyping data interoperability guidelines |
Overview
The PSI PlantScreen Field-Based High-Throughput Plant Phenotyping Platform is a modular, autonomous, field-deployable imaging system engineered for non-invasive, spatially resolved, multi-modal phenotypic characterization of plants under natural environmental conditions. It operates on the principle of functional–structural co-imaging: simultaneous acquisition of physiological status (via chlorophyll fluorescence kinetics), morphological architecture (via RGB + LiDAR), thermal regulation (via infrared thermography), biochemical composition (via hyperspectral reflectance), and growth dynamics (via time-series volumetric reconstruction). Unlike point-scan or single-wavelength laser-based fluorometers, PlantScreen employs true two-dimensional, pixel-wise synchronized imaging—enabling quantitative mapping of photosynthetic efficiency (ΦPSII), photoprotective capacity (NPQ), stress-induced heterogeneity (Fv/Fm spatial variance), and canopy-level energy dissipation patterns across entire plots. Its design addresses core challenges in modern crop science: scalability beyond controlled environments, temporal resolution across diurnal and seasonal cycles, and integration of environmental metadata (PAR, air temperature, soil moisture, CO₂) into trait–environment association models.
Key Features
- Modular sensor architecture: Standard configuration includes high-sensitivity chlorophyll fluorescence imaging (FluorCam technology), 5-megapixel RGB phenotyping, and GPS-referenced autonomous mobility; optional modules include 640×480-pixel microbolometer thermal camera (7.5–13 µm spectral band), push-broom hyperspectral imager (380–1000 nm, 675 bands), and time-of-flight LiDAR for 3D plant structure reconstruction.
- Daylight-capable fluorometry: Triple-wavelength LED excitation system (620 nm modulated measuring light, white actinic light, 735 nm far-red light for Fo′ determination) enables robust Fv/Fm, ΦPSII, and Kautsky transient measurements under ambient irradiance—eliminating need for dark adaptation in many experimental contexts.
- High-fidelity fluorescence detection: Standard 720×560-pixel cooled CCD (50 fps, 12-bit digitization) captures rapid fluorescence transients; optional 1360×1024-pixel sensor (20 fps, 16-bit) enhances spatial resolution for small-canopy or early-stage seedling analysis.
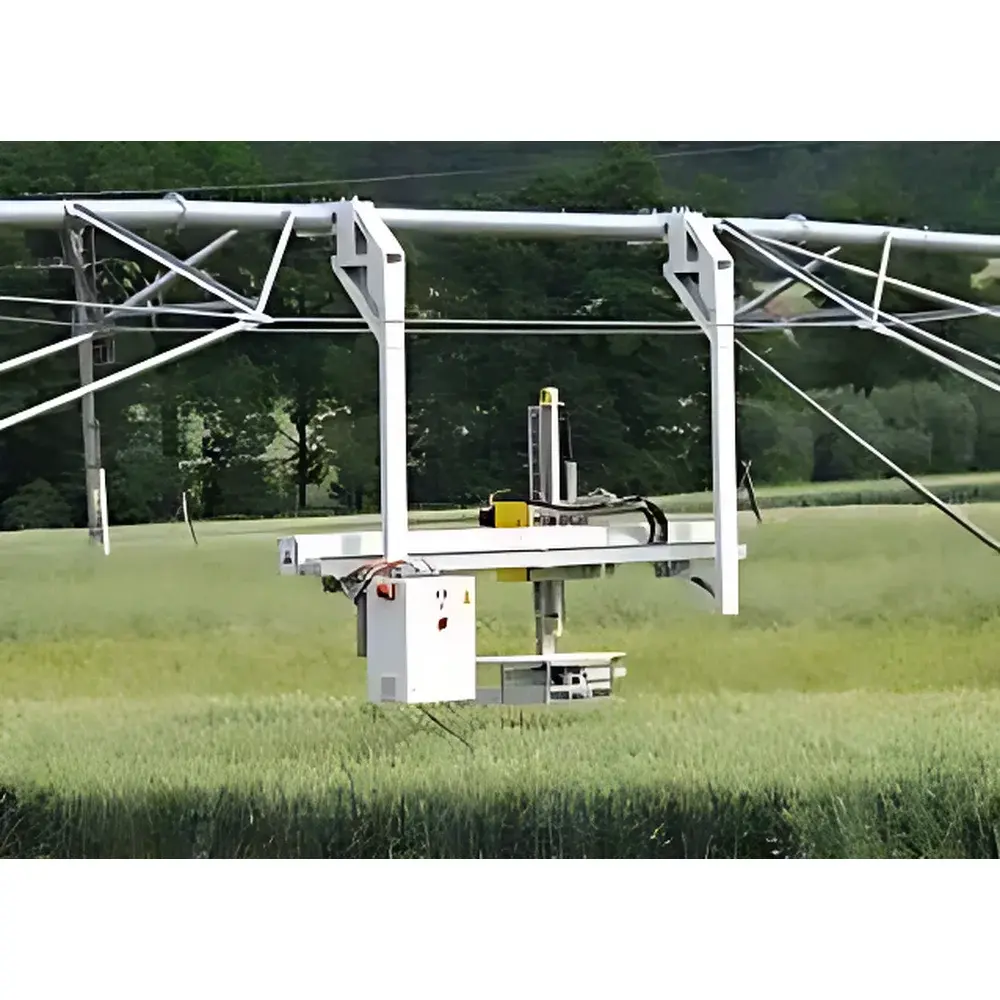
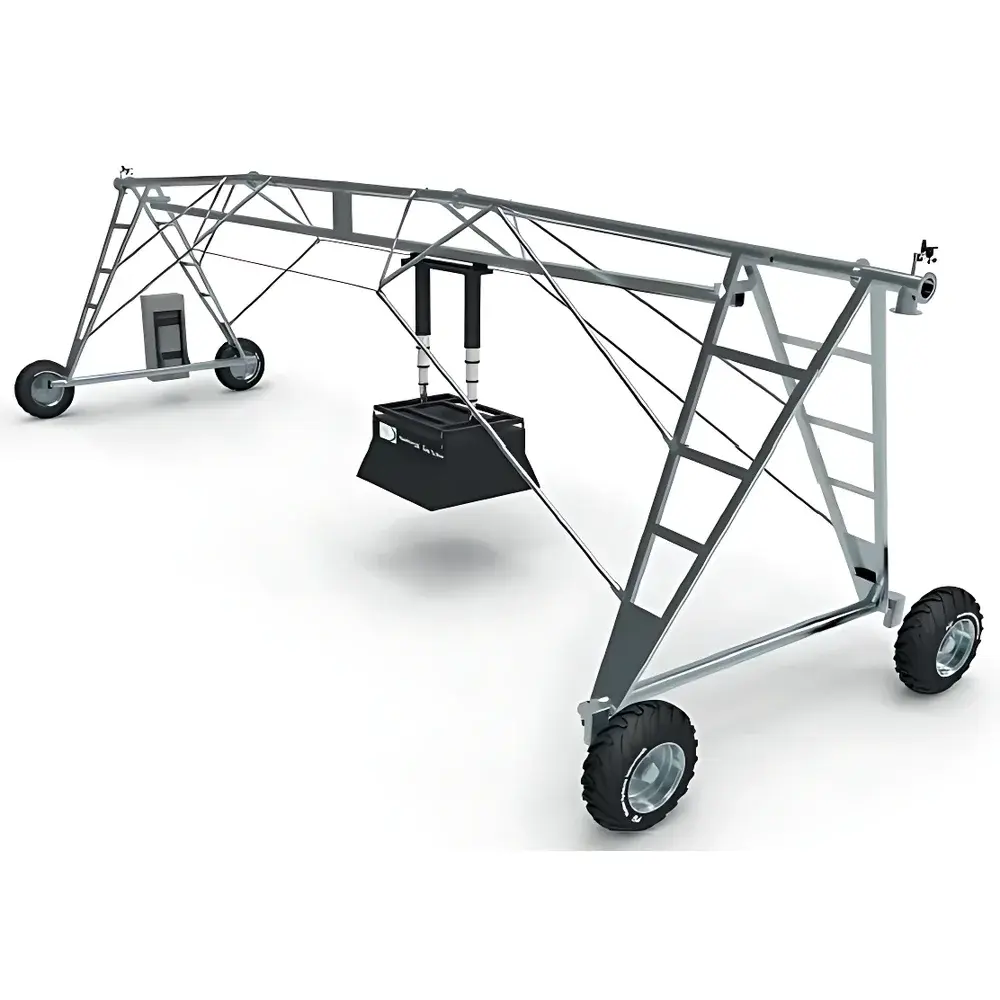
- Field-scale mobility: 12-meter articulated gantry traverses pre-installed rails or unpaved terrain via four pneumatic wheels; achieves 10-meter swath width with sub-3.5 m² per scan; integrated RTK-GPS delivers ≤2 cm georeferencing accuracy for spatiotemporal trait mapping.
- Protocol-driven automation: Preloaded measurement routines (e.g., Fv/Fm in <10 s, NPQ induction kinetics, diurnal ΦPSII profiling) execute unattended; users define custom protocols via drag-and-drop interface with conditional logic (e.g., trigger thermal scan if canopy temperature exceeds threshold).
Sample Compatibility & Compliance
PlantScreen Field accommodates diverse growth forms—from cereals (wheat, rice, maize), legumes (soybean, pea), and oilseed crops (rapeseed) to perennial grasses and tree seedlings—across field plots up to 75 × 20 m. Imaging height is motorized (1.2–3.0 m range), enabling consistent focus across canopy strata. The platform complies with international phenotyping reporting standards: raw data adhere to MIAPPE v1.1 (Minimum Information About a Plant Phenotyping Experiment) metadata schema; spectral calibrations traceable to NIST SRM 2035 and 2036; thermal measurements conform to ISO 18434-1 for infrared thermography in biological applications. All software modules support audit trails and electronic signatures required for GLP-compliant field trials.
Software & Data Management
The PlantScreen Phenomics Suite is built on a LAMP (Linux–Apache–MySQL–PHP) stack with role-based access control and TLS 1.3 encryption. It ingests synchronized streams from all sensors into a normalized relational schema: image cubes (HDF5), time-series trait tables (leaf area index, stomatal conductance proxy, PRI, NDVI), and environmental logs (PAR, VPD, soil θv) are stored in MySQL with indexing optimized for >10⁷-record datasets. Built-in analysis tools include pixel-level fluorescence parameter mapping, automated segmentation using U-Net-trained CNNs (transferable across species), multivariate trait clustering (PCA, t-SNE), and longitudinal growth curve fitting (Gompertz, logistic). Data export supports ISA-Tab, Crop Ontology-compliant JSON-LD, and direct upload to BreedBase or Gramene.
Applications
- Genetic mapping of drought tolerance: Correlate spatially resolved NPQ heterogeneity and thermal canopy gradients with SNP markers in biparental populations.
- Dynamic yield prediction: Integrate daily ΦPSII decline rates, NDVI saturation thresholds, and thermal time accumulation to forecast grain fill duration in maize hybrids.
- Chemical phenotyping: Quantify herbicide mode-of-action effects via time-resolved changes in MCARI1 and PRI across dose-response gradients.
- Root–shoot signaling studies: Combine aboveground fluorescence quenching patterns with co-located soil moisture maps to infer hydraulic redistribution behavior.
- Climate resilience screening: Monitor seasonal acclimation trajectories of Fv/Fm, stomatal conductance proxies (Tc–Ta differentials), and carotenoid-related spectral indices across multi-year common gardens.
FAQ
Can PlantScreen operate under full sunlight without shading structures?
Yes—the FluorCam module uses pulsed 620 nm excitation synchronized with high-speed CCD gating to reject ambient photon noise; validated operation at PPFD >2000 µmol·m⁻²·s⁻¹.
Is calibration required before each field campaign?
Radiometric calibration of RGB and thermal sensors is performed annually using certified reference targets; fluorescence intensity is internally referenced to dark-frame subtraction and LED output monitoring—no user recalibration needed between scans.
How does the system handle wind-induced motion artifacts?
Real-time motion compensation is achieved via inertial measurement unit (IMU)-assisted image stabilization and sub-pixel registration algorithms trained on field-acquired motion blur datasets.
Can data be integrated with genomic selection pipelines?
Yes—Phenomics Suite exports BLUP-ready trait matrices in ASReml-R compatible format; API endpoints enable direct ingestion into AlphaSimR, BGLR, or rrBLUP workflows.
What power sources are supported in remote locations?
The platform operates on 230 V AC (grid or diesel generator) or 48 V DC (battery bank); power management firmware dynamically throttles non-critical subsystems during low-battery conditions to preserve imaging sequence integrity.