Shanda SD-FSX Carbon Black Dispersion Analyzer
| Brand | Shanda |
|---|---|
| Model | SD-FSX |
| Origin | Shandong, China |
| Category | Rubber & Plastic Industry–Specific Instrument |
| Compliance | GB/T 6030–2006 |
| Imaging Sensor | 5 MP CMOS |
| Resolution Options | 640×480, 1024×768, 1280×1024, 2592×1944 |
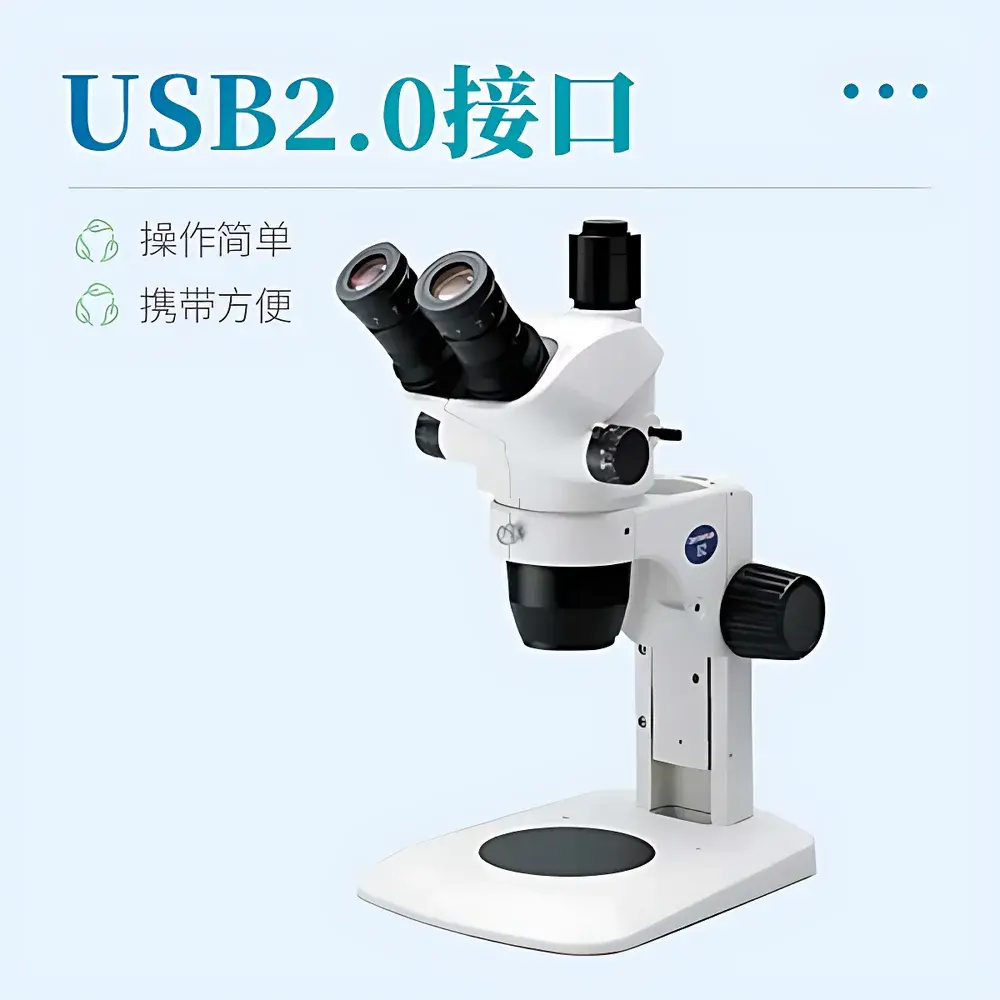
| Interface | USB 2.0 |
| Calibration | Integrated micrometer scale with pixel-to-µm mapping |
| Output Formats | PDF, PNG/JPEG, Excel (.xlsx) |
| Software Compatibility | Windows XP/7/10 (32/64-bit) |
| Image Segmentation Modes | Automated thresholding + manual ROI selection |
| Standard Reference Libraries | ISO-aligned carbon black dispersion image library + user-customizable library |
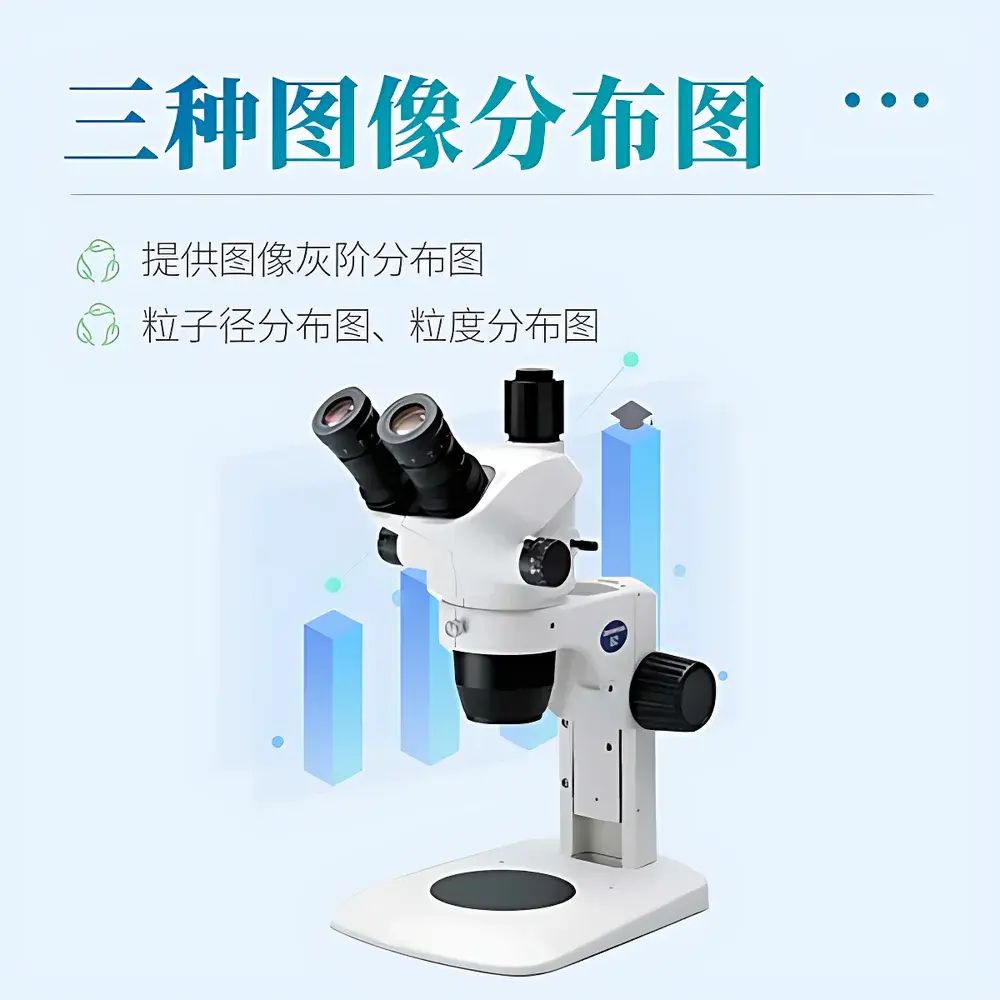
| Data Export | Particle count, equivalent circular diameter (µm), projected area (µm²), grayscale histogram, particle size distribution curve, dispersion rating (0–10 scale per GB/T 6030) |
Overview
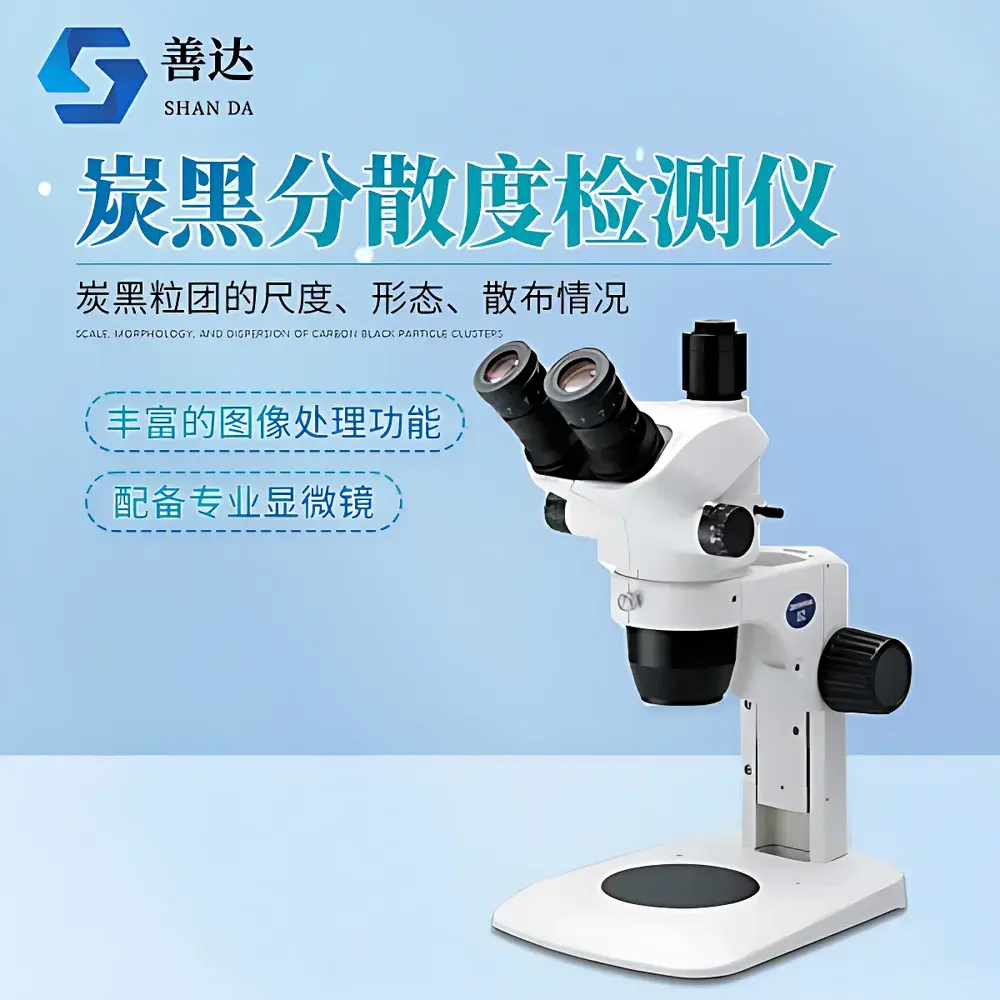
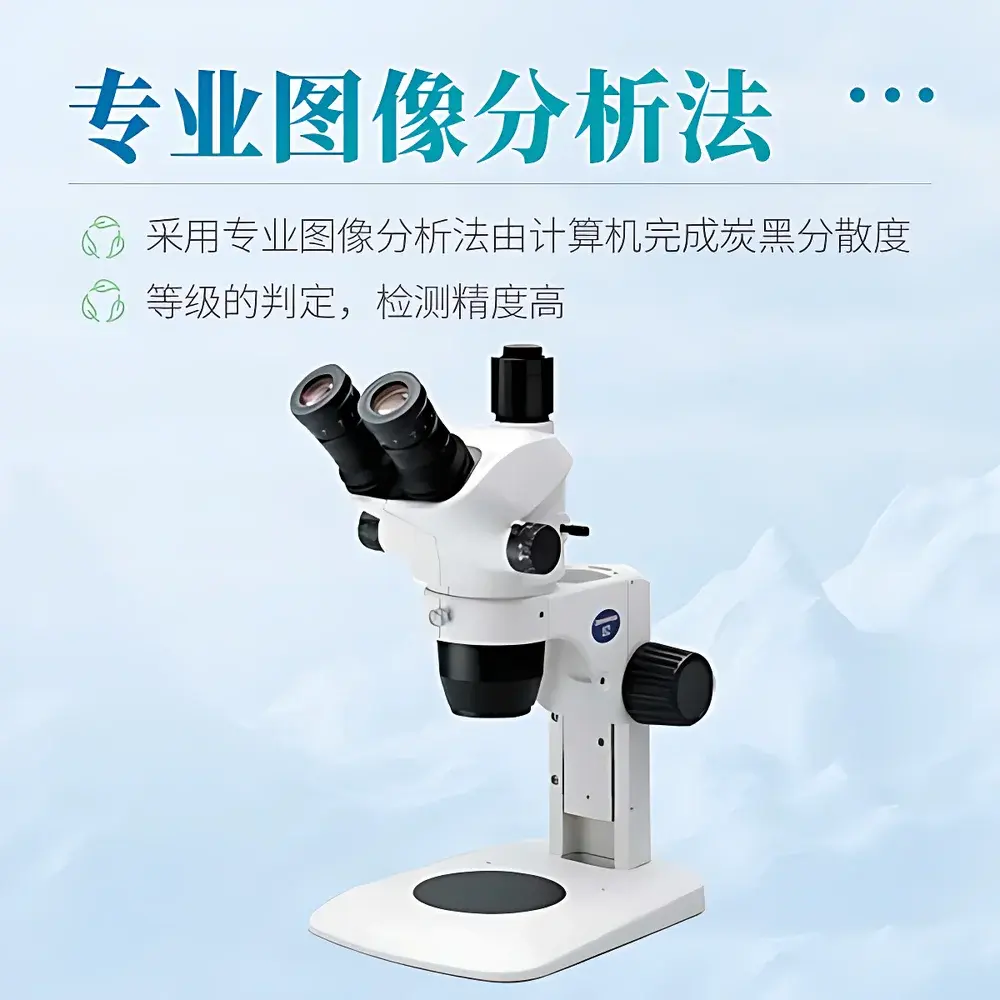
The Shanda SD-FXS Carbon Black Dispersion Analyzer is a dedicated metrology system engineered for quantitative assessment of carbon black agglomerate morphology and spatial distribution in vulcanized rubber compounds. It operates on the principle of digital image analysis applied to high-resolution micrographs captured from polished, etched, or stained rubber cross-sections. The instrument implements the standardized visual comparison methodology defined in GB/T 6030–2006 — which aligns structurally with ISO 11345 and ASTM D7721 — enabling objective, repeatable classification of dispersion quality across six discrete rating levels (1 = poorest, 6 = optimal). Unlike subjective visual grading, this system converts qualitative microstructural observations into traceable, auditable numerical outputs: particle count density (particles/mm²), median agglomerate size (µm), area-weighted dispersion index, and grayscale heterogeneity metrics. Its design targets laboratories requiring GLP-compliant documentation for QC release, formulation optimization, and failure root-cause analysis in tire treads, conveyor belts, seals, and high-performance elastomers.
Key Features
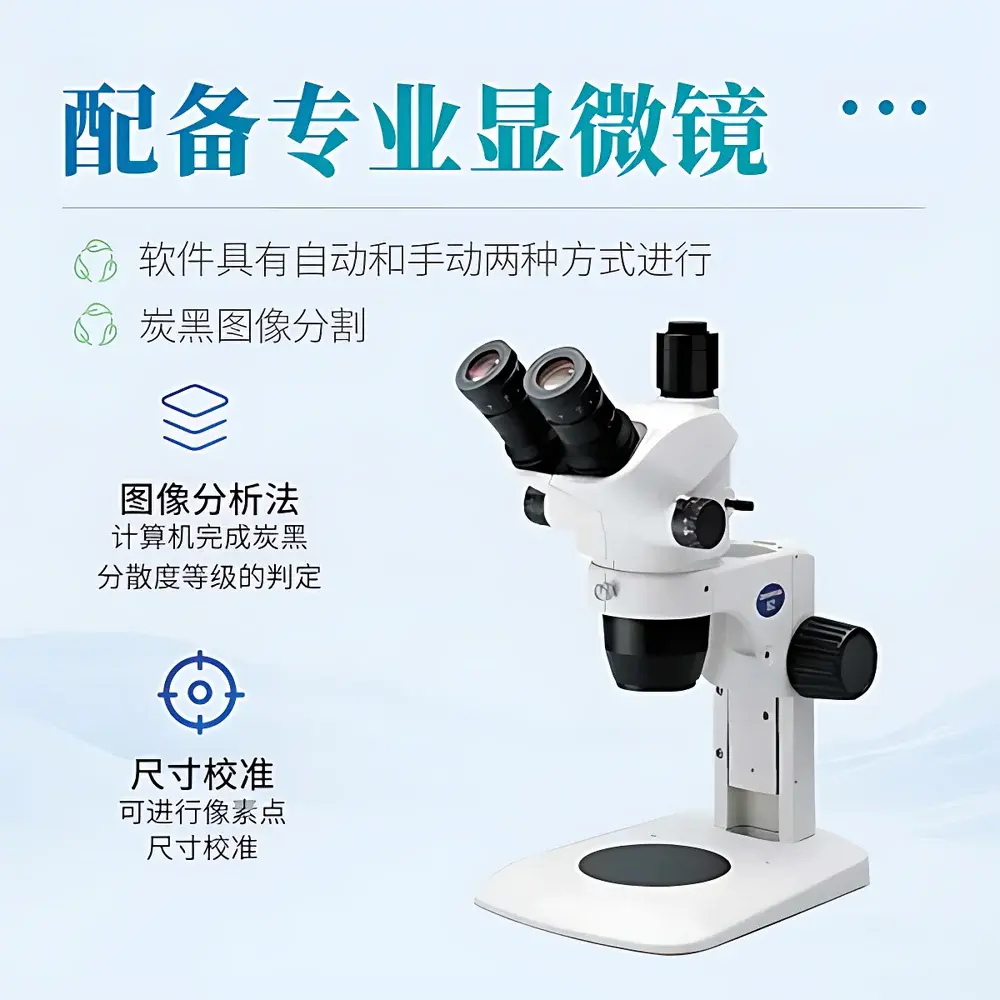
- Computer-assisted dispersion grading per GB/T 6030–2006, eliminating inter-operator variability through algorithmic segmentation and statistical aggregation
- Multi-scale morphometric analysis: detects agglomerates ranging from 1 µm (sub-resolution limit of optical microscopy) to >1 mm using calibrated pixel mapping and dynamic ROI scaling
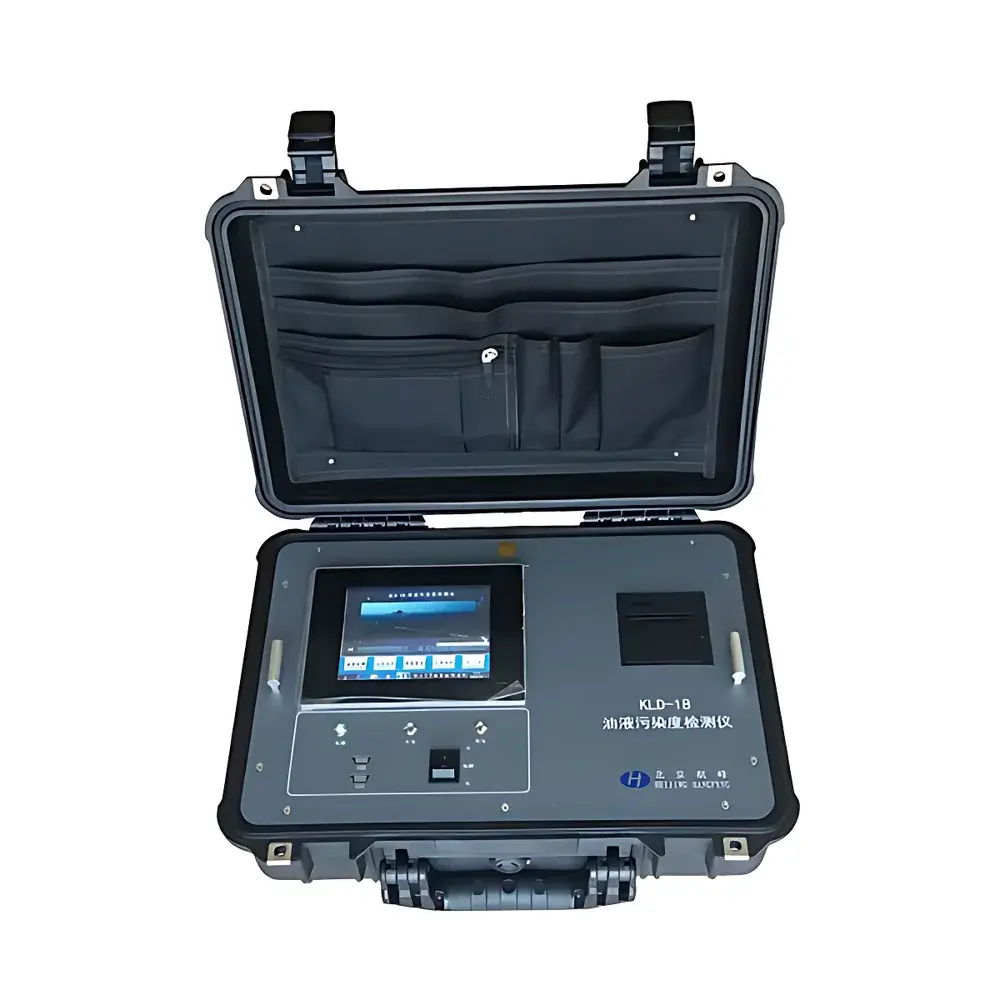
- Integrated 5-megapixel CMOS imaging module with real-time preview, adjustable exposure/gain, and hardware-triggered capture via USB 2.0 interface
- Four native resolution modes (640×480 to 2592×1944) support trade-offs between field-of-view coverage and sub-micron feature resolution
- Dual-mode image segmentation: auto-thresholding (Otsu, IsoData, Triangle algorithms) plus polygonal/manual brush tools for region-specific analysis of critical zones (e.g., near filler–polymer interfaces)
- Precision calibration suite including digital micrometer scale overlay, pixel-size mapping wizard, and two-point Euclidean distance measurement tool
- ISO-referenced standard image library preloaded with 36 graded reference micrographs; supports import/export of user-defined libraries in TIFF/PNG format
- Comprehensive output suite: tabular reports (Excel .xlsx), annotated images (PNG/JPEG), grayscale histograms, cumulative particle size distributions, and PDF-formatted compliance reports with metadata embedding (sample ID, operator, timestamp, instrument SN)
Sample Compatibility & Compliance
The SD-FSX accommodates standard rubber test specimens prepared per ISO 2782-1 or ASTM D3182: cured slabs (2–4 mm thick), compression-molded plaques, or cryo-fractured sections mounted on standard glass slides. Surface preparation methods include solvent etching (toluene/xylene), plasma treatment, or selective oxidation to enhance contrast between carbon black agglomerates and the elastomer matrix. All measurement protocols conform to the sampling, magnification (100×–500× typical), and evaluation criteria specified in GB/T 6030–2006. The system supports audit readiness under ISO/IEC 17025:2017 by logging full acquisition parameters, calibration history, and software version fingerprints within each exported report. While not FDA 21 CFR Part 11–certified out-of-the-box, its audit trail architecture permits configuration for GMP environments with supplementary procedural controls.
Software & Data Management
The proprietary DispersionMaster v4.x software runs natively on Windows platforms (XP SP3 through Windows 10 22H2) without runtime dependencies. It features a modular workflow: image acquisition → calibration → segmentation → morphometry → reporting. Raw images are stored in lossless TIFF format with embedded EXIF metadata. All processing steps are non-destructive and reversible via layered history stack. Batch processing enables sequential analysis of up to 99 samples with consistent parameter sets. Export modules generate ISO-compliant summary tables containing: total particle count, D10/D50/D90 diameters (µm), dispersion rating (0–10), standard deviation of grayscale intensity, and coefficient of variation for agglomerate area. Audit logs record operator login, session duration, parameter modifications, and export events — supporting internal QA review and external accreditation audits.
Applications
- QC release testing of carbon-black-filled SBR, BR, EPDM, and NBR compounds against internal dispersion specifications
- Correlation studies linking dispersion metrics (e.g., D50, particle density) to tensile strength, abrasion resistance, and electrical resistivity
- Process validation of mixing parameters (rotor speed, temperature profile, filler addition sequence) in internal mixers
- Root-cause analysis of premature cracking or fatigue failure attributed to localized agglomeration
- Development of silica–carbon black hybrid fillers where dispersion heterogeneity directly impacts Payne effect magnitude
- Technical service support for compounders evaluating third-party masterbatch quality
FAQ
What magnification is required for compliant analysis per GB/T 6030–2006?
Standard evaluation uses 100× objective magnification (total 1000× with 10× eyepiece), though the system supports 50×–500× depending on target agglomerate size range.
Can the software analyze non-rubber matrices such as thermoplastic elastomers (TPEs)?
Yes — provided sufficient optical contrast exists between filler and polymer phase; users must validate segmentation thresholds for each material system.
Is calibration traceable to national standards?
The micrometer scale is NIST-traceable via certified stage calibration slides (optional accessory); pixel-to-µm conversion is saved per microscope objective and recorded in all reports.
Does the system support automated focus stacking?
No — focus stacking requires manual Z-axis adjustment or integration with motorized stages (not included); flat-field specimen preparation is recommended.
How is dispersion rating calculated?
The software computes a weighted composite score based on agglomerate number density, size distribution skewness, and spatial uniformity index — mapped linearly to the 0–10 scale defined in GB/T 6030–2006 Annex A.
")