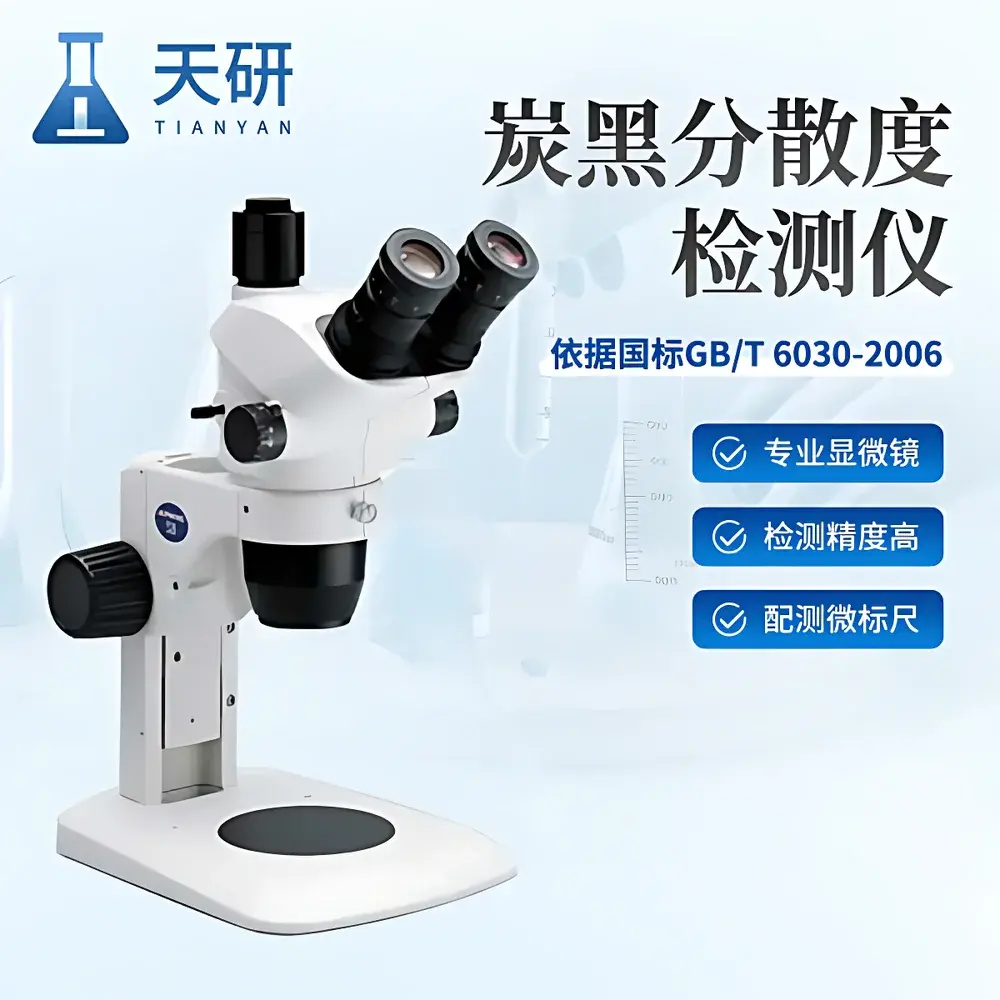
Tianyan TY-FSX Carbon Black Dispersion Analyzer
| Brand | Tianyan |
|---|---|
| Origin | Shandong, China |
| Model | TY-FSX |
| Detection Range | 1 µm – 10 mm |
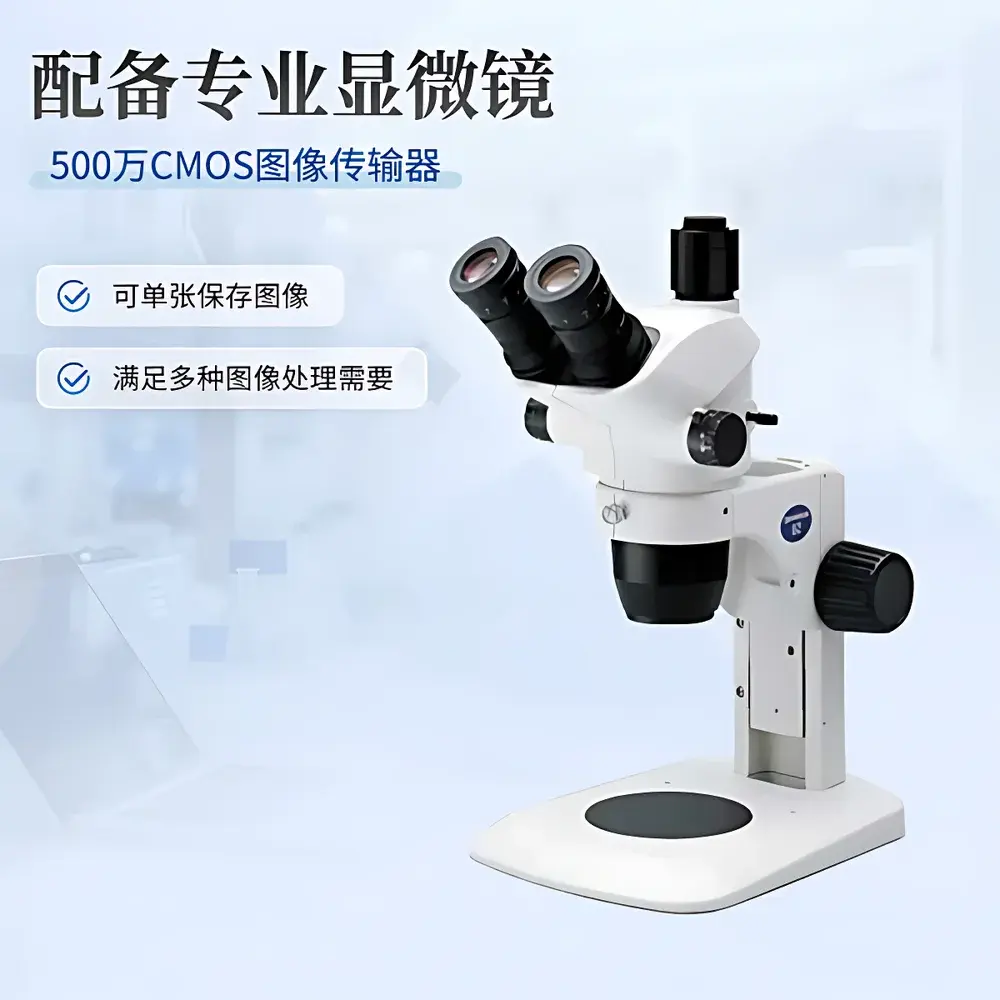
| Imaging Resolution | 2592 × 1944 (5 MP CMOS camera) |
| Optical Magnification | 100× |
| Image Size Options | 640×480, 1024×768, 2048×1536, 2592×1944 |
| Power Supply | 220 V / 2 A / 50 Hz |
| Compliance | GB/T 6030–2006 |
Overview
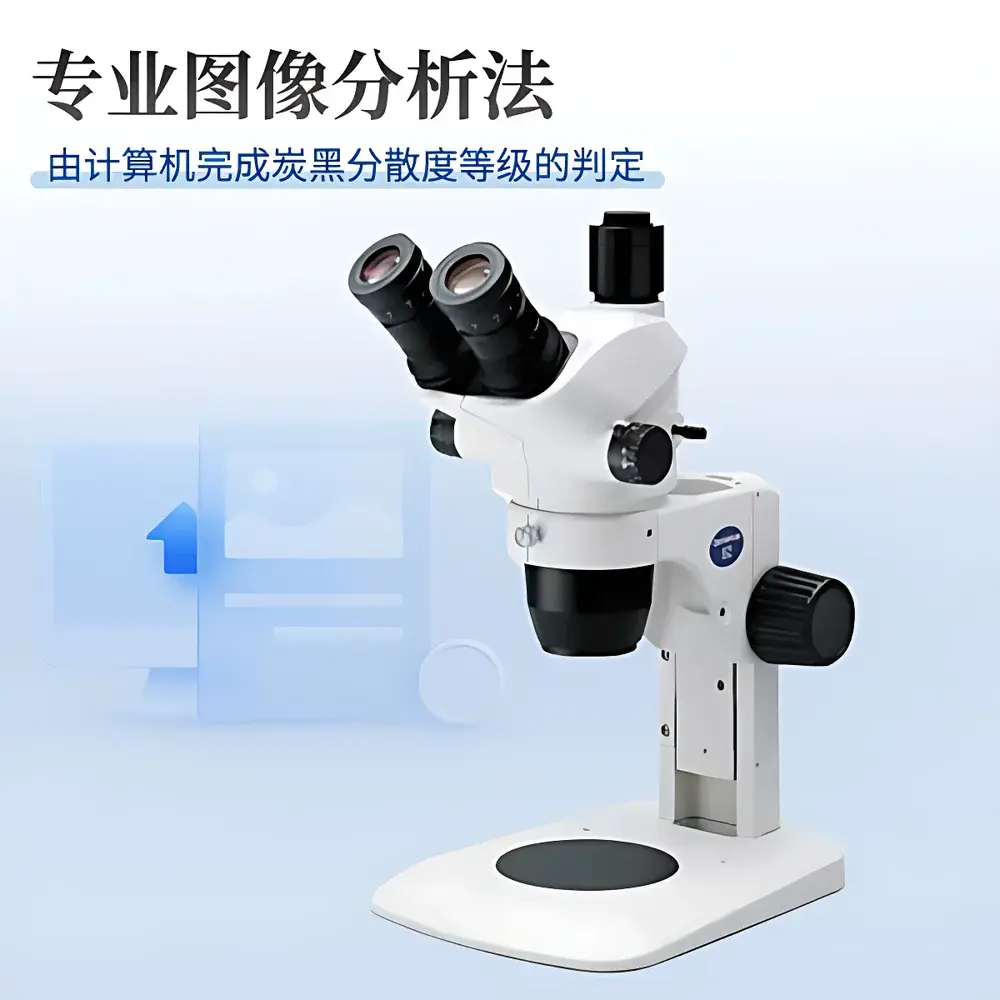
The Tianyan TY-FSX Carbon Black Dispersion Analyzer is a dedicated image-based metrology system engineered for quantitative assessment of carbon black dispersion quality in rubber and thermoplastic elastomer compounds. It operates on the principle of high-resolution optical microscopy coupled with standardized digital image analysis—fully aligned with the methodology defined in GB/T 6030–2006 (“Evaluation of Carbon Black and Silica Dispersion in Rubber—Rapid Comparison Method”). Unlike subjective visual grading, this instrument delivers objective, repeatable metrics—including particle cluster count, equivalent circular diameter (ECD), projected area, aspect ratio, and spatial distribution uniformity—by applying calibrated grayscale thresholding and morphological segmentation to micrographs captured at 100× optical magnification. The system’s measurement range spans from 1 micrometer to 10 millimeters, enabling characterization of both primary aggregates and large-scale agglomerates that critically influence compound reinforcement efficiency, electrical resistivity, tear strength, and aging resistance.
Key Features
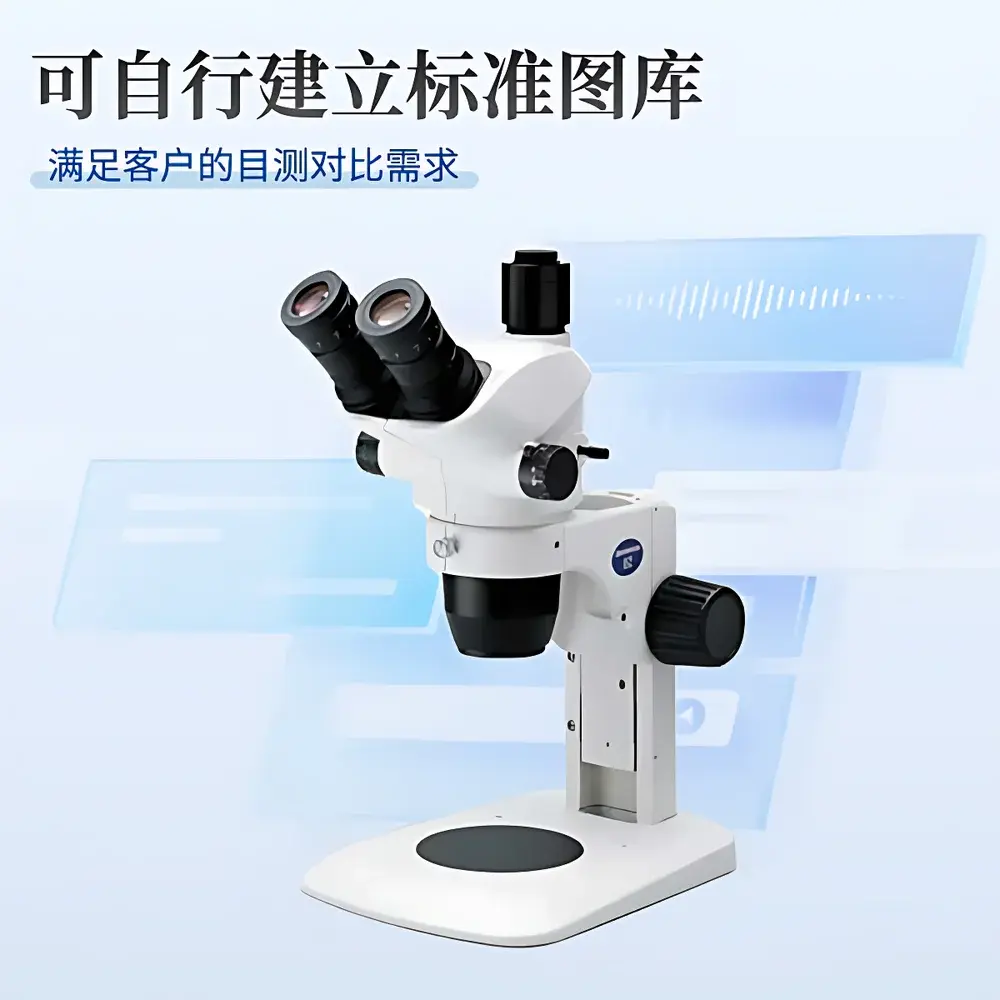
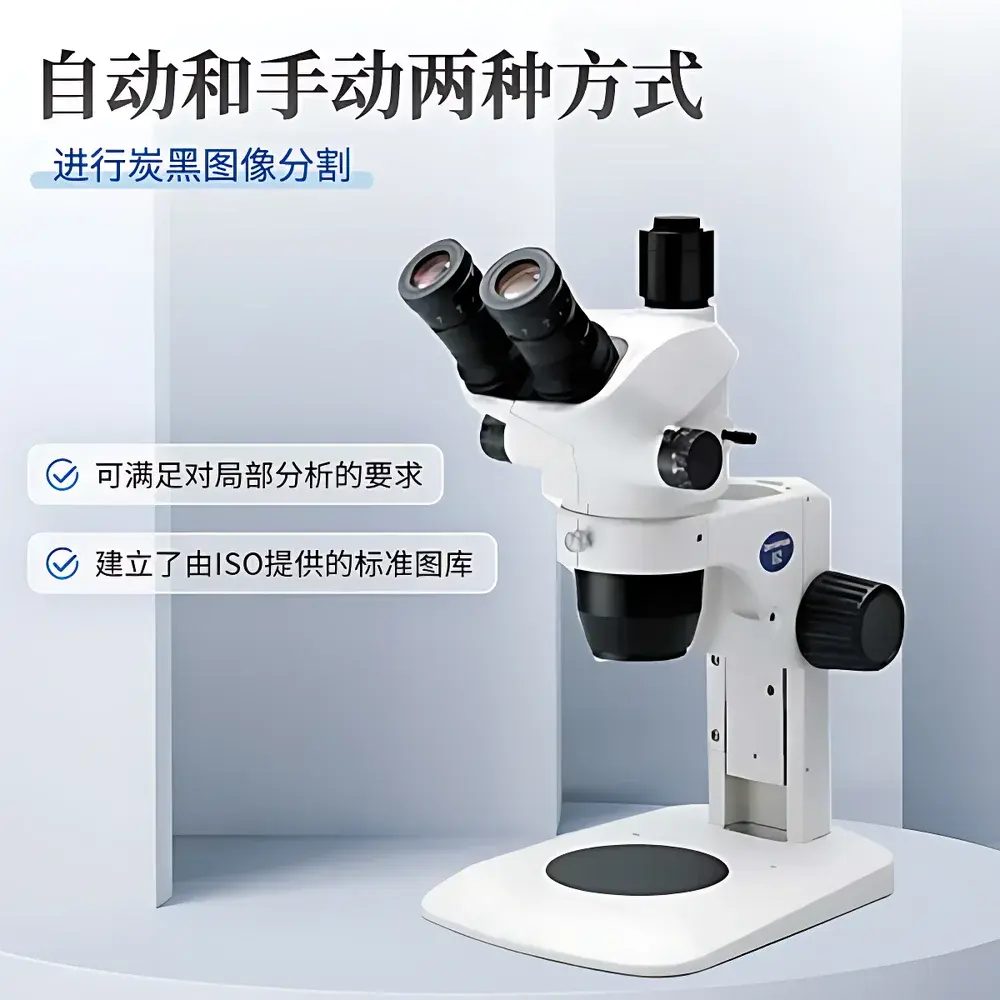
- Automated dispersion grading algorithm compliant with GB/T 6030–2006 reference templates, supporting both ISO-standardized image libraries and user-defined reference sets
- Integrated 5-megapixel CMOS imaging module (2592 × 1944 resolution) with USB 2.0 interface for low-latency frame acquisition and compatibility with third-party digital cameras or microscope-mounted sensors
- Adjustable oblique illumination system allowing variable incident light angles to enhance contrast for low-reflectivity carbon-black-in-rubber sections
- Pixel-calibrated measurement suite featuring dynamic stage-mounted micrometer scale and software-based digital calipers for arbitrary two-point distance, chord length, and Feret diameter quantification
- Dual-mode image segmentation: automatic Otsu-based thresholding and manual polygonal ROI selection for localized analysis of heterogeneous dispersion zones
- Comprehensive output suite including particle count histograms, cumulative size distribution curves (log-normal fit), grayscale intensity profiles, and binary mask overlays
- Multi-format reporting engine generating PDF technical reports (with embedded original micrograph, grayscale histogram, dispersion grade, and metadata) and Excel-exportable datasets (CSV/XLSX) for statistical process control (SPC) integration
Sample Compatibility & Compliance
The TY-FSX analyzer accommodates standard ASTM D2240-compliant rubber vulcanizate thin sections (typically 0.5–1.0 mm thickness), prepared via cryo-microtomy or compression molding followed by surface etching (e.g., RuO₄ vapor staining) to enhance carbon black contrast. Its analytical framework satisfies traceability requirements under GLP and internal QA protocols, with full audit trail support for image acquisition timestamps, operator ID, calibration log entries, and version-controlled analysis parameters. While GB/T 6030–2006 serves as the primary normative reference, the system’s morphometric outputs are directly translatable to ISO 11345–2 (non-destructive testing—weld inspection) particle-agglomeration descriptors and ASTM D7720–17 (standard guide for statistical approaches to developing analytical methods) uncertainty estimation frameworks.
Software & Data Management
The proprietary analysis software runs natively on Windows XP, 7, and 10 (32/64-bit) without runtime dependencies. It implements deterministic image processing pipelines—avoiding AI-based interpolation—to ensure result reproducibility across installations. All raw images are stored with embedded EXIF metadata (exposure time, gain, lens ID, calibration timestamp). Software-generated reports include digital signatures and optional watermarking for controlled document distribution. Data export adheres to ASTM E1447–21 (standard practice for electronic record retention), supporting long-term archival in secure network drives or LIMS-integrated repositories. Audit logs record every parameter modification, image reprocessing event, and library update—meeting minimum documentation expectations for FDA 21 CFR Part 11–aligned environments where electronic records serve as primary data.
Applications
- Quality control of carbon-black-filled SBR, NR, EPDM, and TPE compounds during batch release testing
- Correlation studies linking dispersion metrics (e.g., % area coverage < 1 µm, agglomerate density > 50 µm) to tensile modulus, Shore A hardness, and DIN abrasion loss
- R&D optimization of mixing cycles, rotor design, and dispersing agent dosage in internal mixers
- Root-cause analysis of premature failure in extruded profiles or molded seals exhibiting localized conductive path breakdown
- Supplier qualification audits requiring objective dispersion benchmarking against tier-1 OEM specifications (e.g., Toyota TSM 0001G, Ford WSS-M99P1111-A)
FAQ
Does the TY-FSX comply with international standards beyond GB/T 6030–2006?
Yes—the measurement methodology is functionally equivalent to ISO 247–2013 Annex B (carbon black content determination by thermogravimetric correlation) and supports cross-referencing with ASTM D3182–22 practice for rubber compounding ingredient evaluation.
Can the system analyze silica-filled compounds?
Yes; the adjustable illumination and dual-threshold segmentation allow differentiation of silica agglomerates when stained with appropriate contrast agents (e.g., phosphotungstic acid), per GB/T 6030–2006 Clause 6.3.
Is pixel calibration traceable to NIST standards?
Calibration utilizes certified stage micrometers (±0.5 µm uncertainty, NIST-traceable certificate available upon request); software stores calibration history with date/time stamp and operator ID.
What file formats does the software export for LIMS integration?
CSV (tabular particle statistics), TIFF (lossless micrographs), PDF/A-2b (archival reports), and XML (structured metadata per ASTM E2500–20).
Related Products