WinCELL Wood Cell Analysis Software
| Brand | — |
|---|---|
| Origin | Canada |
| Manufacturer Type | General Distributor |
| Import Status | Imported |
| Model | WinCELL |
| Pricing | Upon Request |
Overview
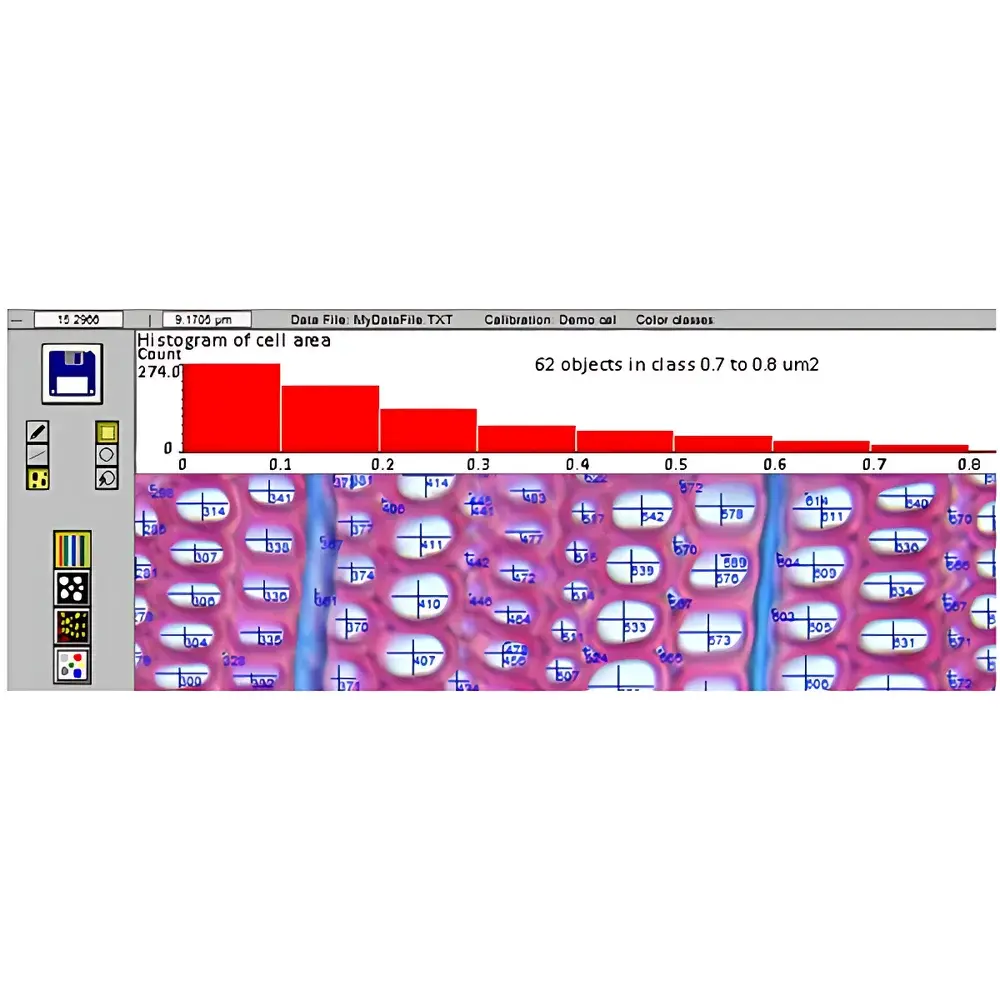
WinCELL is a specialized image analysis software platform engineered for quantitative anatomical characterization of wood microstructure, with primary application in dendrochronological and dendroclimatological research. Unlike indirect density-based methods such as X-ray densitometry (e.g., WinDENDRO), WinCELL operates on high-resolution optical or scanned imagery to directly quantify cellular morphology—including tracheid (xylem cell) dimensions, lumen-to-wall area ratios, spatial distribution across growth rings, and tissue-type composition. Its measurement foundation rests on pixel-based geometric segmentation and calibrated area quantification, ensuring traceable, reproducible morphometric outputs aligned with anatomical reality—not inferred approximations. The software supports both research-grade validation studies and routine phenotyping workflows in plant physiology, forest ecology, and climate-proxy reconstruction.
Key Features
- Calibration-Aware Image Processing: Supports user-defined spatial calibration via microscope objectives or scanning resolution metadata; accommodates TIFF/BMP input from TWAIN-compliant scanners and digital cameras.
- Flexible Region-of-Interest (ROI) Definition: Enables analysis of full-frame images or arbitrarily shaped ROIs; all measurements dynamically update upon ROI resizing or repositioning.
- Automated Tracheid Morphometry: Computes lumen area, cell wall area, and lumen-to-wall ratio per cell—without reliance on circularity assumptions or diameter-derived estimates.
- Multi-Category Cell Classification: Distinguishes tracheids, vessels, and parenchyma cells; supports manual annotation refinement and color-based classification (Pro version only).
- Dimensional Metrics: Derives mean and individual tracheid length and width using four validated algorithms—accounting for radial vs. tangential orientation and anisotropic cell geometry.
- Spatial Positioning & Distribution Analysis: Records centroid coordinates relative to ring boundaries, enabling radial gradient profiling of cell size, density, or wall thickness within annual increments.
- Batch Processing Mode: Executes fully automated analyses across large image sets where segmentation parameters remain consistent—ideal for time-series or multi-site datasets.
- Configurable Output Schema: Saves results in native WinCELL format or WinDENDRO-compatible CSV/Excel structures; supports customizable field selection (e.g., ring width, cell count, lumen area sum, group-wise statistics).
Sample Compatibility & Compliance
WinCELL accepts grayscale and RGB images acquired from light microscopy, macro photography, or flatbed scanning—provided sufficient contrast and resolution (≥1200 dpi recommended for reliable tracheid boundary detection). It complies with standard digital image analysis practices outlined in ASTM D143 (Standard Test Methods for Small Clear Specimens of Timber) and ISO 13061-1 (Wood — Physical and mechanical properties — Determination of density). While not a regulated medical device, its output metrics support GLP-aligned data integrity when used with documented calibration protocols, version-controlled configuration files, and audit-trail-enabled Excel integration via XLCell. All processing steps are deterministic and repeatable under identical parameter settings.
Software & Data Management
WinCELL operates as a standalone Windows application (64-bit), requiring Microsoft Excel (2016 or later) for XLCell-assisted visualization and cross-tabular reporting. Calibration profiles, ROI templates, and analysis presets are saved as portable .cfg files, facilitating method transfer between users and laboratories. Raw and annotated images export in lossless TIFF or BMP formats; measurement logs include timestamps, operator ID fields (user-entered), and embedded calibration metadata. XLCell extends analytical capability by generating scatter plots, radial distribution heatmaps, and grouped statistical summaries—enabling rapid verification of segmentation fidelity and biological trends. No cloud storage or remote telemetry is employed; all data reside locally unless explicitly exported by the user.
Applications
- Dendroclimatology: Correlating intra-annual tracheid metrics (e.g., lumen area gradients) with seasonal temperature/precipitation records.
- Wood Quality Assessment: Quantifying fiber length, wall thickness, and microfibril angle proxies for pulp yield, strength, and dimensional stability prediction.
- Tree Physiology Studies: Monitoring cambial response to drought, CO₂ enrichment, or nutrient stress through dynamic changes in cell production rate and geometry.
- Phylogenetic Comparative Anatomy: Standardizing cross-species xylem trait measurements for evolutionary analyses.
- Leaf Area Index (LAI) Estimation: Leveraging WinCELL’s generic area-measurement mode for non-wood botanical samples (e.g., leaf lamina, root cross-sections).
FAQ
Does WinCELL require proprietary hardware?
No—WinCELL works with standard digital imaging equipment meeting minimum resolution and contrast requirements. Scanner or camera must support TWAIN drivers for direct acquisition.
Can WinCELL import images from confocal or SEM sources?
Yes, provided images are saved in TIFF or BMP format with embedded or separately supplied calibration information (e.g., µm/pixel). Grayscale intensity linearity must be preserved.
What distinguishes the Regular and Pro versions?
The Pro version adds color-channel decomposition for enhanced lumen/wall segmentation in stained sections and enables area quantification per user-defined RGB threshold class—critical for multi-tissue staining protocols.
Is batch processing compatible with mixed-resolution image sets?
No—batch mode assumes uniform calibration and segmentation behavior. Heterogeneous image sets require per-image calibration and interactive validation prior to automation.
How does WinCELL handle partially occluded or damaged cells?
Cells intersecting the ROI boundary are excluded from mean-value calculations by default; users may adjust edge-exclusion tolerance or manually reconstruct fragmented cells using brush/lasso editing tools.