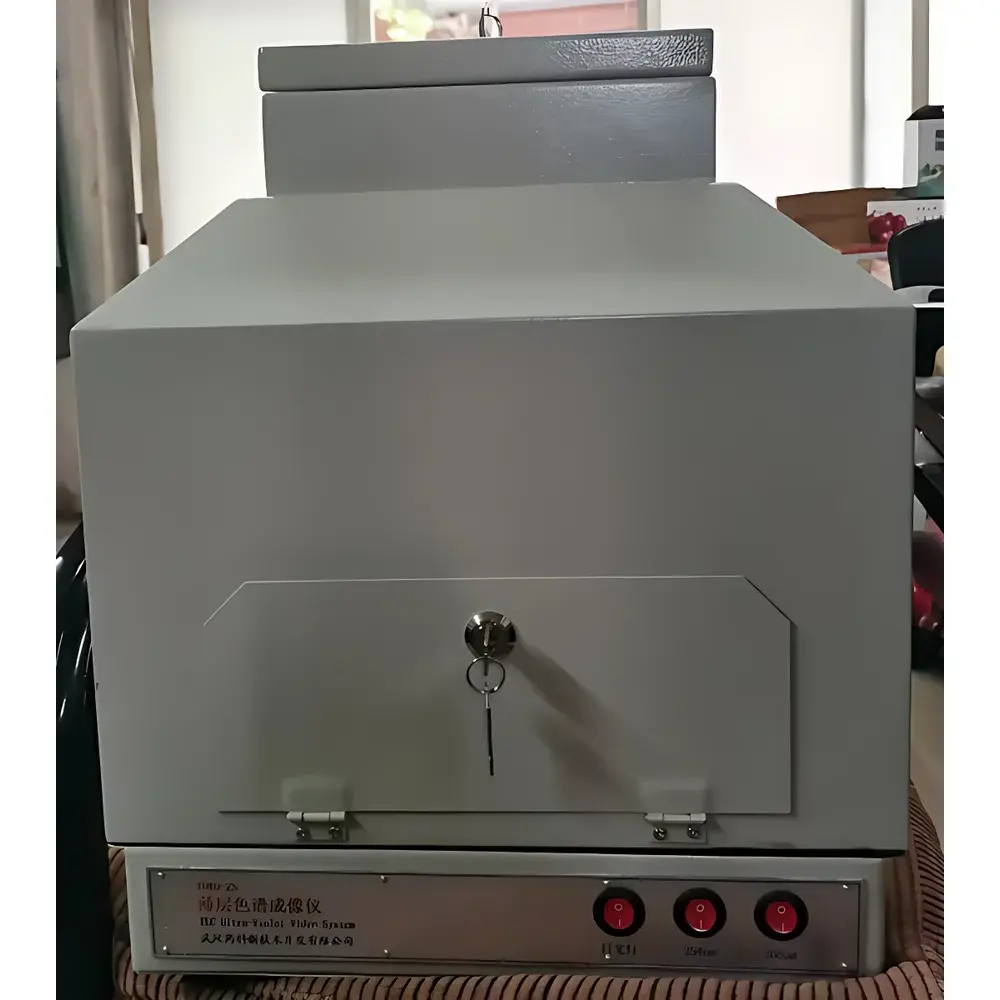
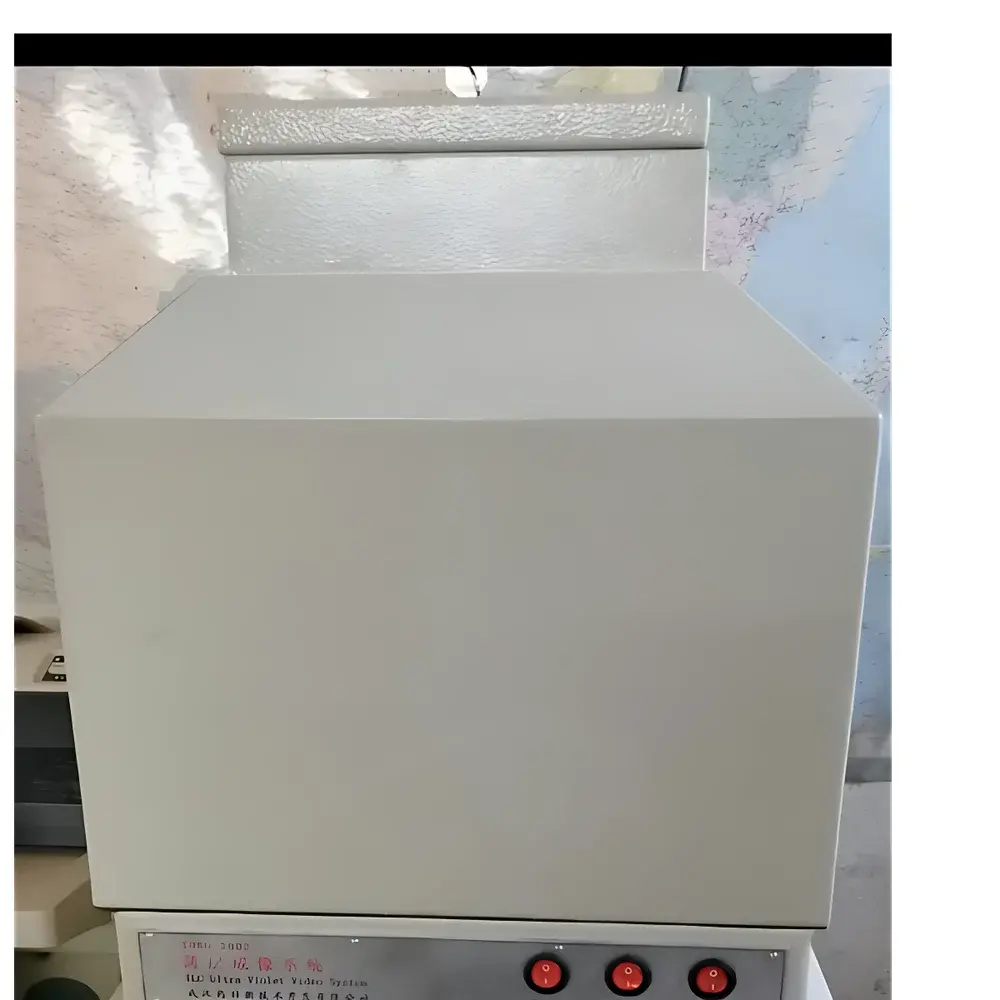
YOKO YOKO-2002 Automated TLC Imaging System
| Brand | YOKO |
|---|---|
| Model | YOKO-2002 |
| Instrument Type | Preparative Thin-Layer Chromatography Imaging System |
| Operation Mode | Automatic |
| Detection Method | Fluorescence and Reflectance |
| Wavelength Range | 200–700 nm |
| Light Source | UV (254 nm & 365 nm) and Visible |
| Monochromator | Fluorescence Linear Scanning |
| Spectral Bandwidth | 6 mm |
| Wavelength Accuracy | ±1 nm |
| Wavelength Repeatability | ±0.2 nm |
| Minimum Spatial Resolution | 10 µm |
| Imaging Wavelengths | 254 nm, 365 nm |
| Sample Stage Dimensions | 200 × 200 mm |
| Maximum Scan Speed | 100 mm/s |
| Quantitative Algorithms | Normalization, Internal Standard, External Standard (Single-Point Linear, Two-Point Quadratic) |
| Software Platform | Windows XP/2000/NT |
| Regulatory Compliance | Designed to support USP <621>, EP 2.2.27, and ChP monograph requirements for TLC densitometry |
Overview
The YOKO YOKO-2002 Automated TLC Imaging System is a dedicated densitometric imaging platform engineered for high-precision qualitative and quantitative analysis of compounds separated on thin-layer chromatography (TLC) plates. It operates on the principle of controlled linear scanning with simultaneous multi-wavelength excitation and digital image capture, enabling both reflectance and fluorescence-based detection. Unlike conventional visual or manual densitometers, the YOKO-2002 integrates optical calibration, motorized stage control, and algorithm-driven spot integration to deliver reproducible Rf determination and peak-area quantification—critical for method validation in pharmaceutical quality control, natural product standardization, and herbal medicine authentication.
Key Features
- Automated linear scanning with selectable dual-wavelength (254 nm / 365 nm) and multi-channel acquisition modes for comparative band profiling
- High-resolution optical detection system with 10 µm spatial resolution, supporting accurate localization and boundary definition of TLC spots
- Dual-mode detection: reflectance (for UV-absorbing compounds) and fluorescence (for native or derivatized fluorescent analytes)
- Calibrated UV-Vis illumination source with stable output across 200–700 nm, including fixed-band UV LEDs at 254 nm and 365 nm
- Motorized XY stage (200 × 200 mm travel range) with programmable scan speed up to 100 mm/s and positional repeatability better than ±0.2 nm
- Integrated spectral bandwidth control (6 mm) and wavelength accuracy (±1 nm), ensuring compliance with pharmacopoeial densitometric specifications
- Real-time image enhancement suite: adjustable hue, saturation, contrast, brightness, and arbitrary rotational correction for optimal band visualization
Sample Compatibility & Compliance
The YOKO-2002 accommodates standard silica gel, alumina, cellulose, and reversed-phase TLC plates (up to 20 × 20 cm), including pre-coated and hand-cast layers. Its detection flexibility supports both direct visualization of UV-active compounds and post-chromatographic derivatization followed by fluorescence imaging. The system is designed to meet analytical requirements outlined in major pharmacopoeias—including United States Pharmacopeia (USP) Chapter “Chromatography”, European Pharmacopoeia (Ph. Eur.) 2.2.27 “Thin-Layer Chromatography”, and Chinese Pharmacopoeia (ChP) General Chapters 0502 and 0512. Quantitative workflows incorporate internal standard normalization and external calibration models (single-point linear and two-point quadratic), fully traceable for GLP/GMP environments requiring audit-ready data integrity.
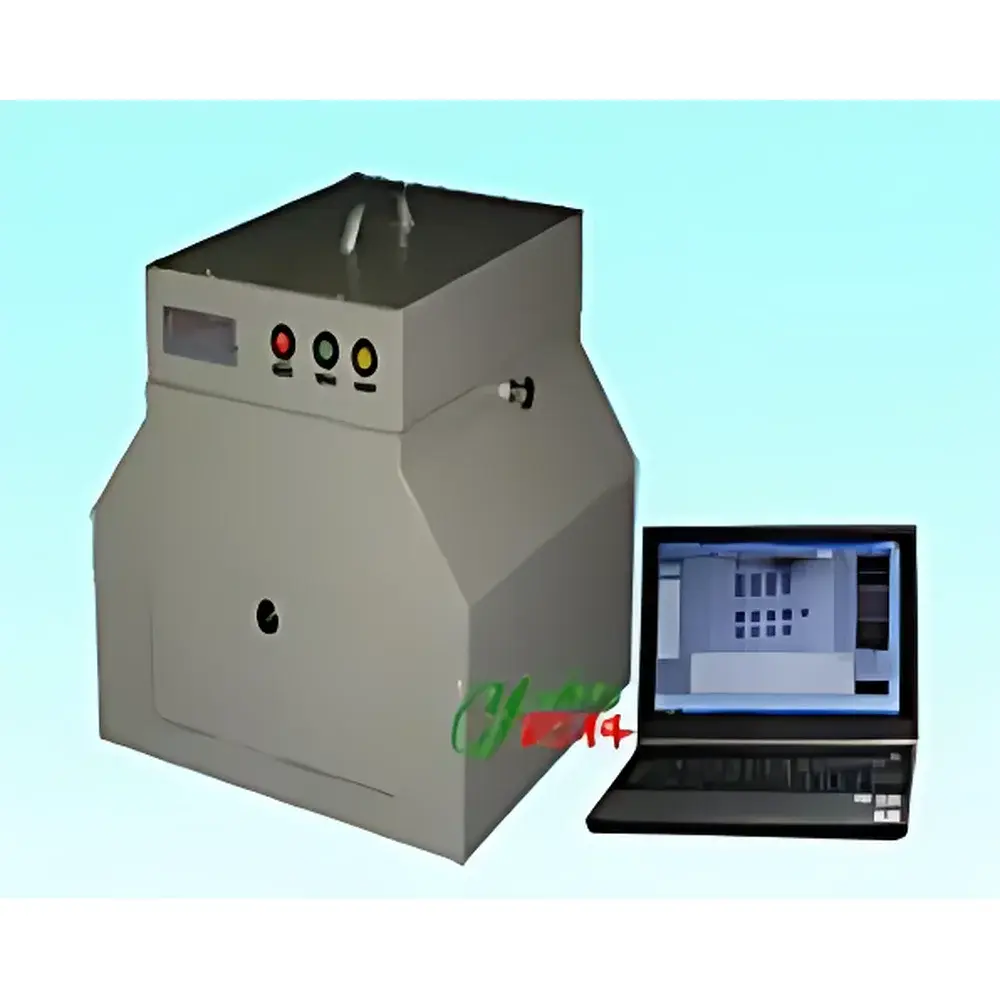
Software & Data Management
The native Windows-based application provides a bilingual (English/Chinese) GUI optimized for laboratory technicians and QC analysts. It includes an embedded tutorial module with annotated operational diagrams and step-by-step protocol guidance. All acquired images are stored with metadata (wavelength, gain, exposure time, plate ID, operator timestamp), supporting unlimited spectral database archiving. Peak integration employs centroid-based Rf calculation and area-under-curve (AUC) quantification with baseline correction algorithms. Export formats include CSV (for LIMS integration), TIFF (lossless archival), and PDF reports containing annotated chromatograms, Rf tables, peak area ratios, and calculated assay values—all formatted per pharmacopoeial reporting conventions. While the software predates FDA 21 CFR Part 11 compliance frameworks, its audit trail functionality (user log, parameter change history, report generation logs) aligns with core ALCOA+ principles for data reliability.
Applications
The YOKO-2002 is routinely deployed in herbal medicine laboratories for fingerprinting and assay of marker compounds in raw botanicals—including *Panax notoginseng*, *Coptis chinensis*, *Epimedium sagittatum*, *Andrographis paniculata*, *Schisandra chinensis*, and *Rheum palmatum*. In finished product testing, it supports batch release of TCM formulations such as Zhibai Dihuang Wan, Xianglian Wan, Huanglian Shangqing Wan, and Tianma Shouwu Pian. Its robustness extends to stability-indicating methods for degradation product profiling, excipient interference assessment, and purity verification of isolated phytochemicals prior to HPLC injection. Academic users apply it for rapid method scouting, solvent system optimization, and teaching chromatographic fundamentals via real-time image overlay and Rf simulation tools.
FAQ
What types of TLC plates are compatible with the YOKO-2002?
Standard commercial plates (silica gel 60 F254, aluminum-backed or glass-supported, up to 20 × 20 cm) and custom-prepared layers are supported. Flexible stage clamping ensures flatness during high-speed scanning.
Does the system support post-derivatization imaging?
Yes—fluorescence imaging after reagent spraying (e.g., anisaldehyde-sulfuric acid, vanillin-H2SO4) or heating is fully enabled via programmable delay intervals and thermal-safe UV exposure protocols.
Can Rf values be exported in machine-readable format?
All Rf measurements, peak areas, and calibration curves are exportable as CSV files compatible with Excel, MATLAB, and statistical process control (SPC) platforms.
Is hardware calibration traceable to NIST standards?
Wavelength calibration is performed using certified holmium oxide and didymium filters; spatial resolution is verified using USAF 1951 resolution targets. Certificate of Conformance accompanies each instrument shipment.
What maintenance is required for long-term optical stability?
Annual lamp output verification and stage alignment recalibration are recommended. UV LED sources exhibit >10,000-hour service life with negligible intensity drift under continuous operation.
Related Products