Youyunpu YP-G20 Portable Canopy Analyzer for Leaf Area Index (LAI) Measurement
| Brand | Youyunpu |
|---|---|
| Origin | Shandong, China |
| Manufacturer Type | Direct Manufacturer |
| Country of Origin | China |
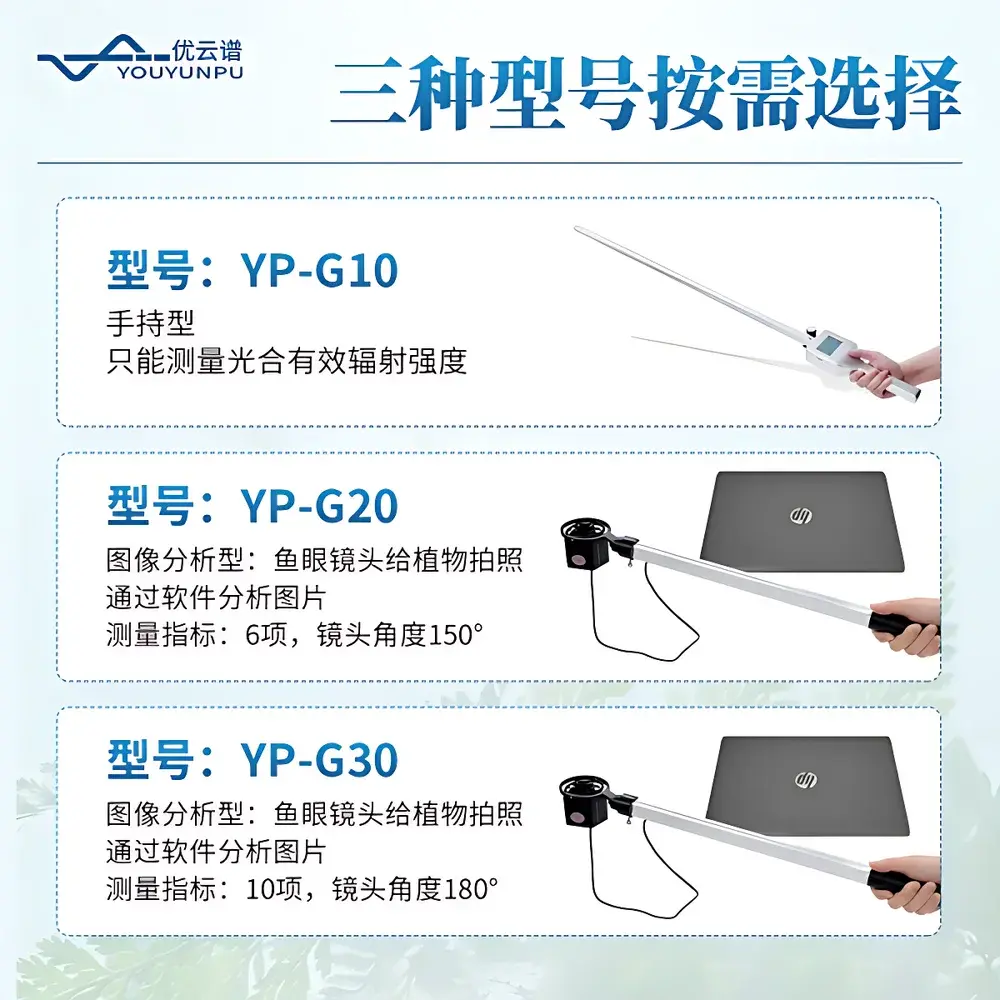
| Model | YP-G20 |
| Price Range | USD 1,200 – 3,400 (FOB) |
| Measurement Principle | Hemispherical Digital Image Analysis |
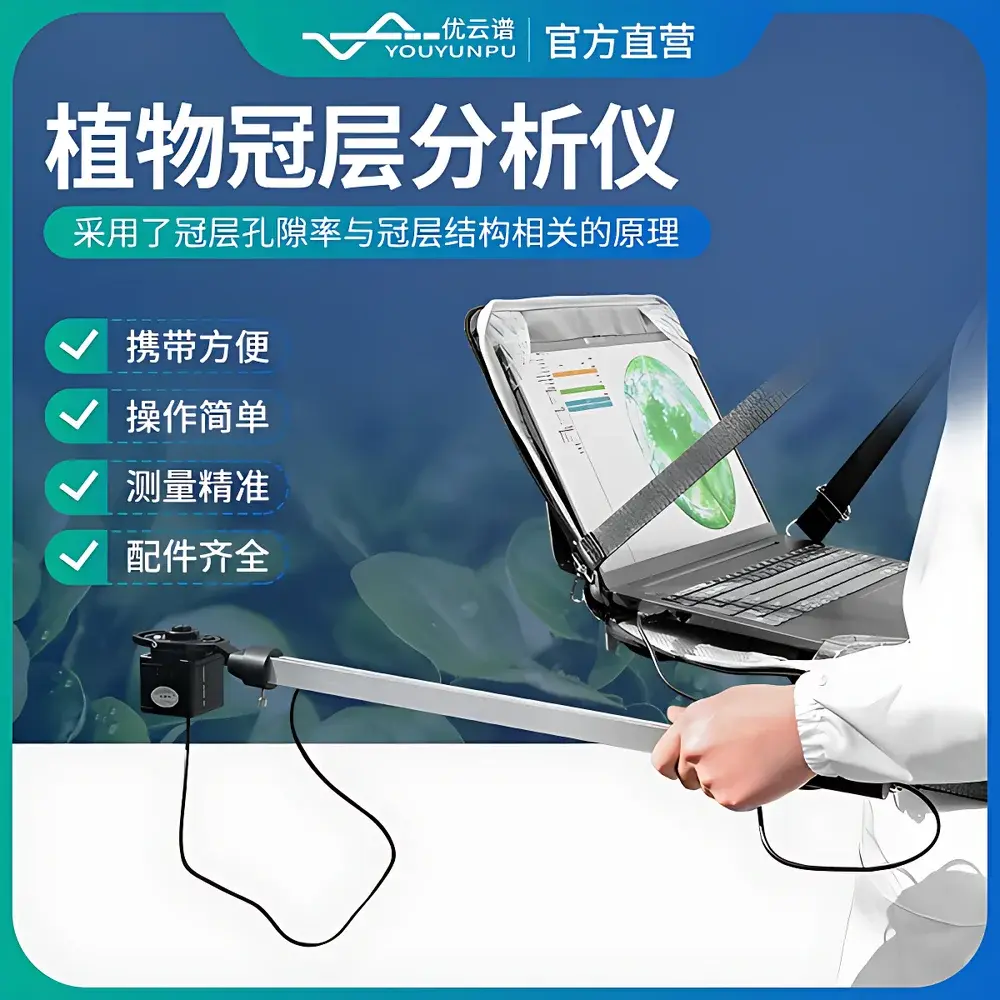
| Instrument Type | Handheld Portable Unit |
| Spectral Sensitivity Range | 400–700 nm (Photosynthetically Active Radiation, PAR) |
Overview
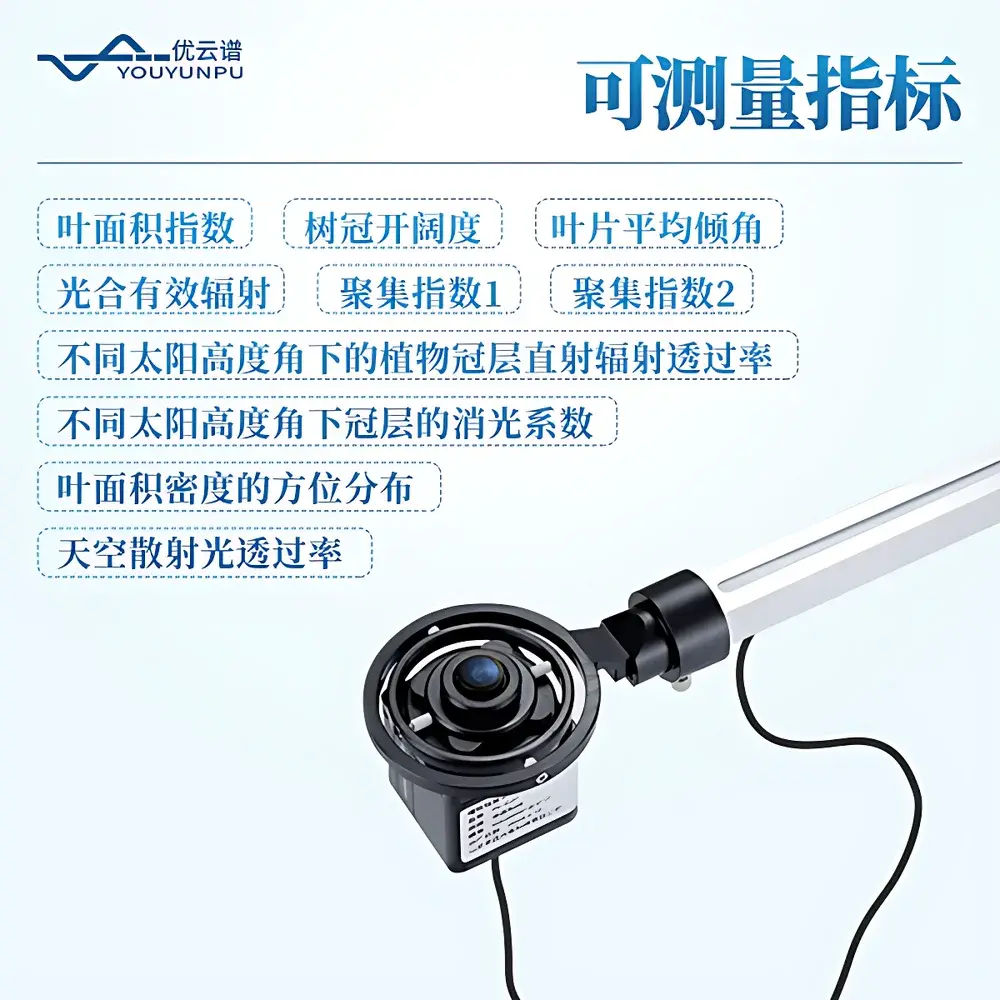
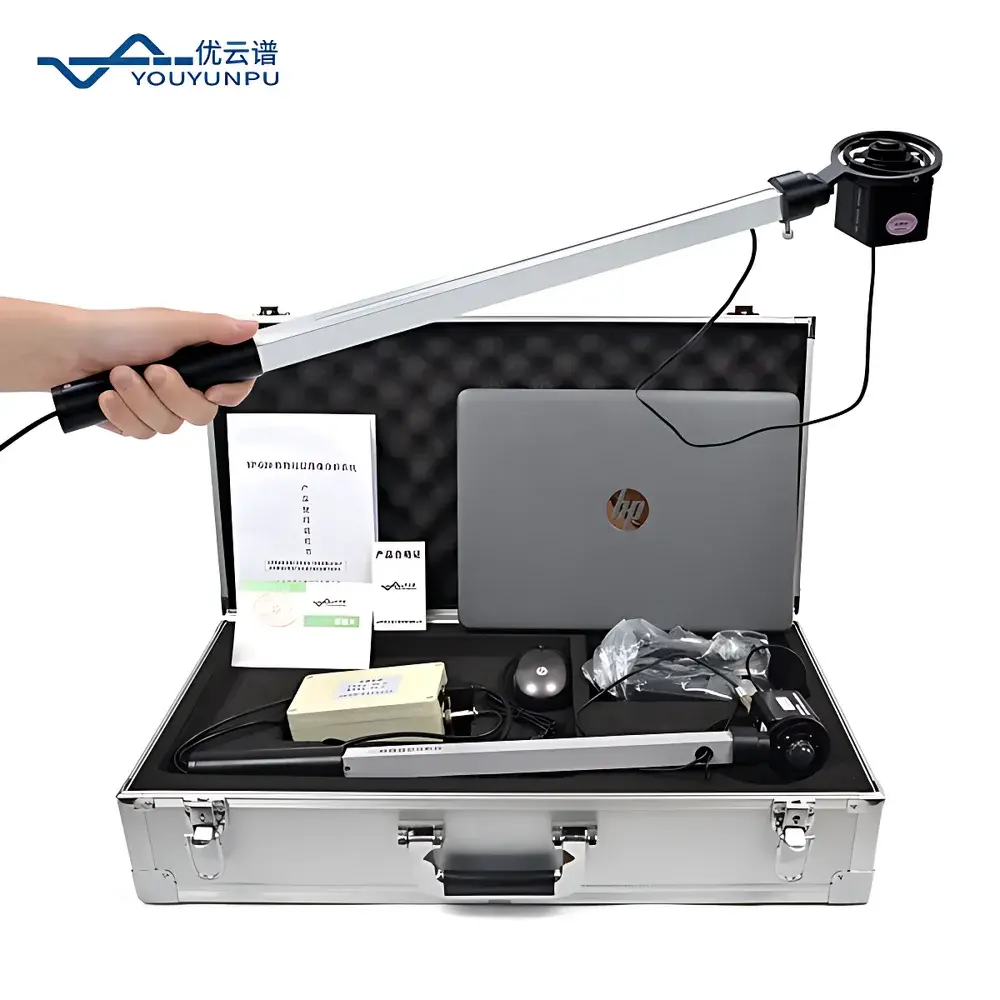
The Youyunpu YP-G20 Portable Canopy Analyzer is an optical field instrument engineered for rapid, non-destructive quantification of plant canopy architecture in situ. It operates on the hemispherical photography principle—capturing downward-facing fisheye images of the sky through the plant canopy—and applies validated radiometric models rooted in Beer-Lambert law and gap fraction theory to derive structural parameters. Specifically, it computes Leaf Area Index (LAI), canopy closure, gap fraction, direct and diffuse site factor, and clumping index by analyzing pixel-level transmission of photosynthetically active radiation (PAR; 400–700 nm) across the hemispherical dome. Unlike point-based sensors or destructive sampling methods, the YP-G20 delivers spatially integrated measurements over a defined ground area (~1 m² typical footprint), enabling consistent inter-site comparisons in ecological monitoring, agronomic trials, and forest inventory applications.
Key Features
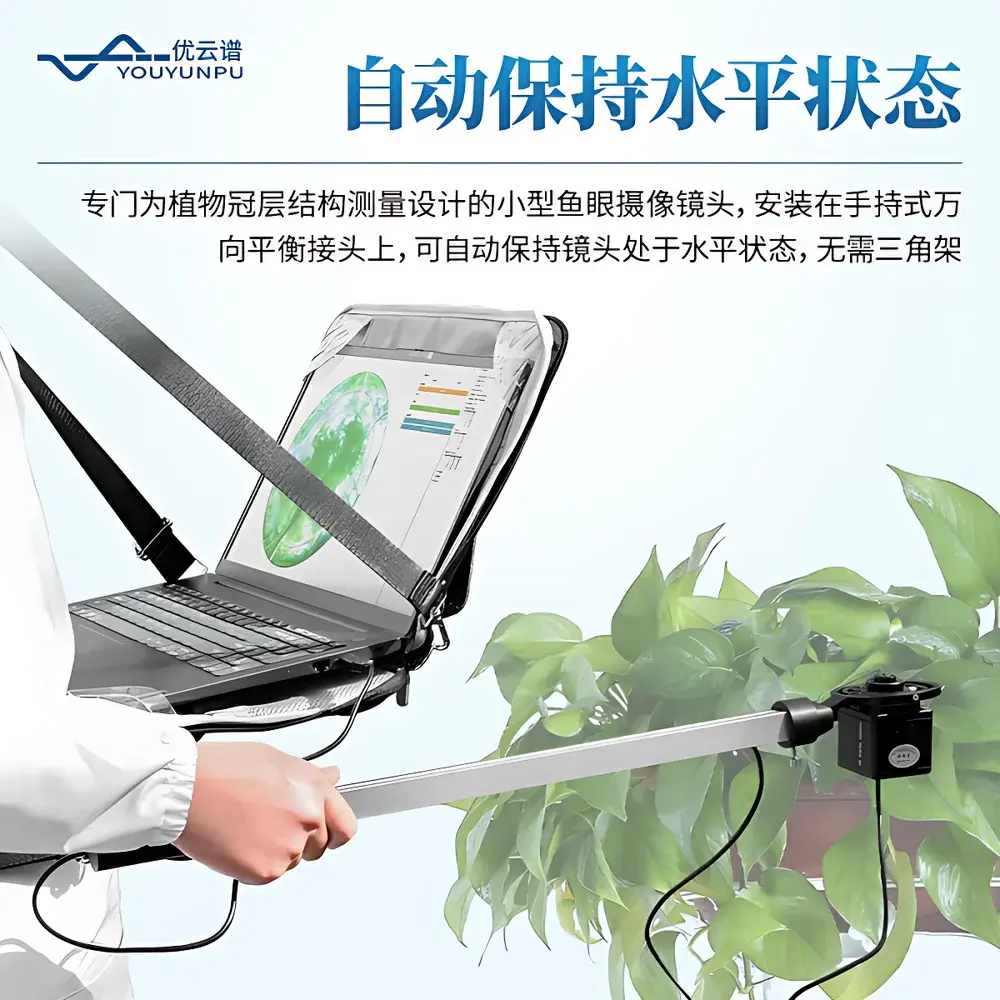
- Fisheye lens system with built-in electronic leveling: A compact, wide-angle (180° field-of-view) optical module mounted on a gimbal-balanced handheld arm ensures automatic horizon alignment without tripods—even on uneven terrain or sloped plots.
- Modular vertical profiling capability: The extendable measurement arm (with calibrated length markings) allows precise positioning of the sensor at multiple heights within the canopy (e.g., 0.5 m, 1.0 m, 1.5 m), supporting stratified LAI estimation and vertical light extinction profiling.
- PAR-optimized CMOS imaging: High-resolution CCD/CMOS sensor with spectral response matched to 400–700 nm band ensures accurate capture of photosynthetic photon flux distribution under variable ambient lighting (clear sky, overcast, or partial shade).
- Real-time image preview and threshold adjustment: On-device display enables immediate visual verification of image quality and manual optimization of brightness/contrast thresholds prior to analysis—critical for robust segmentation of green canopy elements from background soil, stems, or shadows.
- Lightweight and field-rugged design: Total unit weight < 1.8 kg; IP54-rated housing resists dust ingress and incidental moisture exposure during extended outdoor deployment.
Sample Compatibility & Compliance
The YP-G20 is compatible with herbaceous crops (e.g., wheat, maize, soybean), shrubs, young orchards, and low-canopy forests (height ≤ 5 m). It requires no calibration against reference standards for routine LAI estimation but supports user-defined validation protocols using concurrent destructive LAI sampling (e.g., leaf litter collection + planimetry). While not certified to ISO 13837 or ASTM E2916 (which pertain to laboratory-grade optical instruments), its methodology aligns with internationally accepted protocols described in Jonckheere et al. (2004, Agricultural and Forest Meteorology) and the FAO’s Guidelines for Crop Monitoring Using Remote Sensing. Data outputs comply with FAO Agro-Meteorological Data Exchange Format (AMDEF) conventions for interoperability with GIS and crop modeling platforms (e.g., DSSAT, APSIM).
Software & Data Management
The bundled YP-G20 Analysis Suite (Windows-compatible, v3.2+) provides full control over image processing workflows. Users define up to 10 zenith angle zones (0°–10°, 10°–20°, …, 80°–90°) and 10 azimuth sectors (0°–36°, …, 324°–360°) to compute directional gap fractions and LAI gradients. Region-of-interest (ROI) masking tools allow exclusion of edge effects, gaps caused by missing plants, or non-canopy obstructions (e.g., fence posts, irrigation pipes). All processing steps—including threshold selection, sky/cloud masking, and LAI calculation—are logged with timestamps and user annotations. Export formats include CSV (for statistical analysis in R/Python), GeoTIFF (georeferenced canopy maps), and PDF reports compliant with GLP documentation requirements for field trial audits.
Applications
- Long-term phenological monitoring of canopy development in climate change research plots.
- High-throughput phenotyping in breeding programs evaluating drought tolerance or light-use efficiency traits.
- Validation of satellite- and UAV-derived LAI products (e.g., Sentinel-2, PlanetScope) at ground-truth scale.
- Assessment of canopy light interception dynamics in agroforestry systems and intercropping trials.
- Supporting carbon sequestration modeling by linking LAI time-series to net primary productivity (NPP) estimates.
FAQ
What is the minimum and maximum recommended canopy height for accurate YP-G20 measurements?
Optimal performance is achieved for canopies between 0.3 m and 5.0 m tall. Below 0.3 m, ground reflection may bias gap fraction; above 5.0 m, fisheye distortion increases uncertainty in zenith angle assignment.
Does the YP-G20 require external power sources or batteries during field use?
It operates on a rechargeable lithium-ion battery (7.4 V, 4,400 mAh) providing ≥ 6 hours of continuous operation under mixed lighting conditions.
Can the software process images captured with third-party fisheye lenses?
Yes—provided the input image is a full 180° hemispherical projection (equirectangular or stereographic) with known focal length and center coordinates, the software accepts TIFF or PNG files via batch import.
Is cloud-based data synchronization supported?
No native cloud sync is implemented; however, exported CSV and GeoTIFF files are fully compatible with AWS S3, Google Drive, or institutional LIMS platforms via manual upload or scripted API integration.
How does the YP-G20 handle overcast versus clear-sky conditions?
The 400–700 nm spectral band ensures stable contrast under both diffuse (overcast) and direct-beam (clear-sky) illumination. Software includes adaptive sky-cloud detection to suppress cloud-induced noise in gap fraction computation.
Related Products