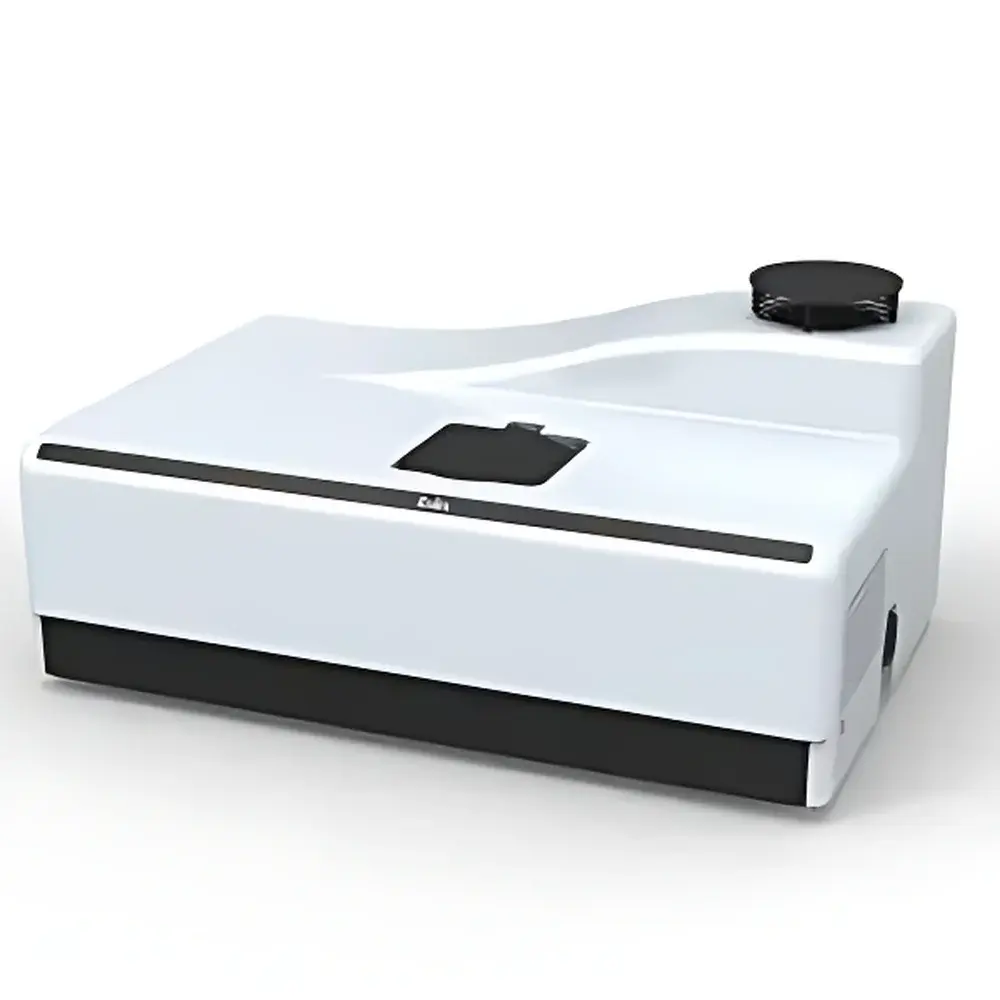
ZOLIX SmartFluo-Pro Molecular Fluorescence Spectrometer
| Brand | ZOLIX |
|---|---|
| Origin | Beijing, China |
| Manufacturer Type | Direct Manufacturer |
| Product Category | Domestic |
| Model | SmartFluo-Pro |
| Price | USD 25,000 (FOB) |
| Dispersive Element | Holographic Grating |
| Slit Width (Spectral Bandpass) | 5 nm |
| Spectral Resolution | 5 nm |
| Detection Limit | <0.1 µg/L quinine sulfate in 0.1 mol/L H₂SO₄ |
| Wavelength Accuracy | ±1 nm |
| Excitation Range | 200–800 nm |
| Emission Range | 200–800 nm |
| Excitation Monochromator | 200 mm focal length, Czerny–Turner configuration, low stray light design |
| Grating Density | 1800 grooves/mm @ 400 nm |
| Wavelength Repeatability | ±0.5 nm |
| Integration Time | 100 µs to 24 s |
| Standard Sample Holder | Quartz cuvette (10 mm path length) |
| Dimensions (L×H×W) | 620 × 415 × 300 mm |
| Weight | 25 kg |
Overview
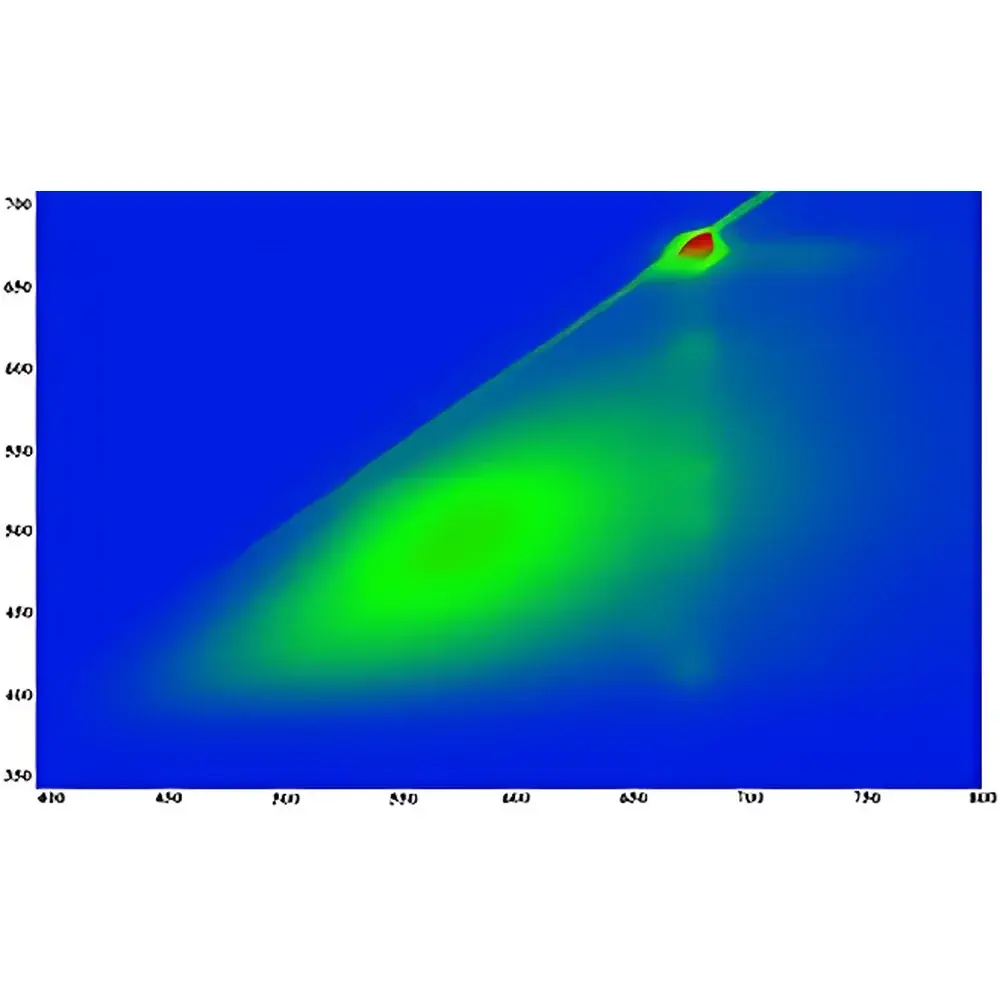
The ZOLIX SmartFluo-Pro Molecular Fluorescence Spectrometer is a high-performance, research-grade instrument engineered for rapid acquisition and quantitative analysis of three-dimensional (3D) fluorescence excitation–emission matrices (EEMs). Based on the principle of photoluminescence spectroscopy, it employs a 150 W continuous xenon arc lamp as its broadband excitation source, coupled with dual monochromators—optimized for both excitation and emission scanning—to deliver precise, reproducible spectral data across the full 200–800 nm range. The system operates under controlled optical geometry and calibrated wavelength dispersion (1800 grooves/mm grating at 400 nm), enabling accurate identification and quantification of fluorescent organic compounds—including dissolved organic matter (DOM), polycyclic aromatic hydrocarbons (PAHs), amino acids, humic substances, and trace contaminants such as pesticide residues—in liquid-phase samples. Its core capability lies in generating EEM datasets that resolve overlapping fluorophore signatures through spatial separation in excitation–emission space, thereby supporting advanced chemometric modeling and multivariate calibration.
Key Features
- Full-spectrum 3D fluorescence mapping: Simultaneous acquisition of excitation–emission matrices (EEMs) with user-defined scan ranges, step increments, and integration times (100 µs to 24 s).
- Dual-monochromator architecture: Independent excitation and emission pathways featuring 200 mm focal length Czerny–Turner optics and low-stray-light design for enhanced signal-to-noise ratio and reduced spectral interference.
- Integrated Rayleigh and Raman scatter correction: Algorithm-based subtraction of elastic (Rayleigh) and inelastic (Raman) scattering bands using reference water scans, yielding artifact-free EEMs suitable for PARAFAC decomposition and peak deconvolution.
- Multi-modal spectral acquisition: Supports conventional fluorescence spectra, excitation spectra, synchronous fluorescence spectra (Δλ = constant), and 3D synchronous fluorescence mapping—all within a single software interface.
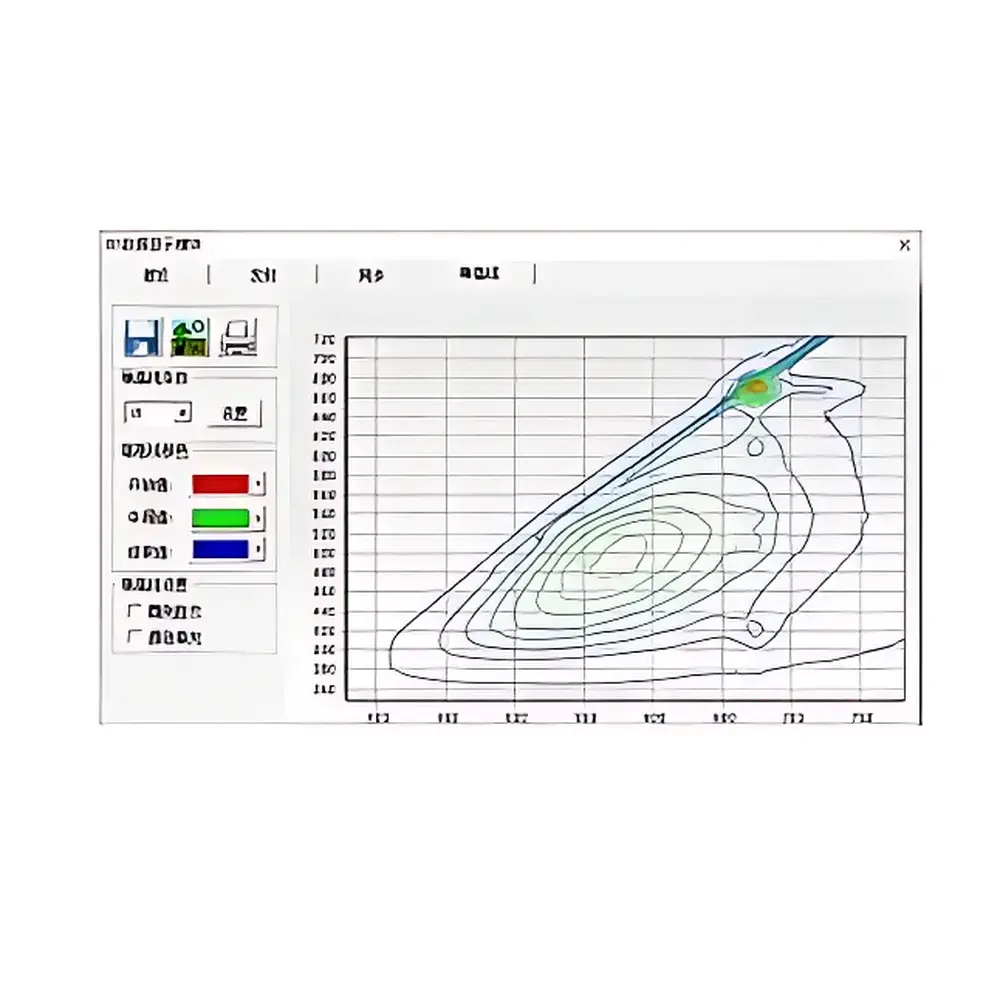
- Real-time 3D visualization and manipulation: Interactive rotation, tilt, zoom, and contour projection of EEM surfaces for intuitive qualitative interpretation and region-of-interest (ROI) selection.
- Excitation and emission spectral correction: Built-in standard lamp-based correction routines to compensate for wavelength-dependent source intensity and detector responsivity, ensuring photometric accuracy across the full operational range.
Sample Compatibility & Compliance
The SmartFluo-Pro accepts standard 10 mm path-length quartz cuvettes and supports aqueous, organic, and mixed-solvent systems with minimal sample volume requirements (typically 2–3 mL). It complies with fundamental metrological principles outlined in ISO/IEC 17025 for analytical instrument validation and supports GLP-compliant workflows via audit-trail-enabled software logging. While not certified to FDA 21 CFR Part 11 out-of-the-box, its data export architecture (CSV, ASCII, MATLAB-compatible .mat) facilitates integration into validated LIMS or ELN environments requiring electronic record integrity. Method development aligns with ASTM D5907 (fluorescent DOM characterization in water) and USP guidelines for analytical instrument qualification (AIQ), particularly for detection limit verification (<0.1 µg/L quinine sulfate in 0.1 mol/L H₂SO₄) and wavelength accuracy assessment (±1 nm).
Software & Data Management
The proprietary SmartFluo Control Suite provides an intuitive Windows-based interface for instrument control, real-time spectral preview, and post-acquisition processing. Key modules include EEM normalization, baseline correction, scatter band masking, peak integration, and ROI extraction—yielding derived 1D spectra (e.g., fluorescence intensity profiles at fixed excitation, or emission slices at fixed λex). Export formats include comma-separated values (CSV), Unicode text, and hierarchical data format (HDF5) for compatibility with Python (NumPy/Pandas), MATLAB, and chemometrics platforms such as The Unscrambler® or Pirouette®. All measurement metadata—including lamp hours, grating position, slit width, integration time, and environmental conditions (if logged externally)—are embedded in file headers to ensure traceability. Software versioning, user access levels, and electronic signature support are configurable to meet internal QA/QC protocols.
Applications
- Environmental water quality monitoring: Rapid profiling of DOM composition in surface water, wastewater effluent, and drinking water treatment streams; correlation of EEM features with microbial activity, pollution sources, and disinfection by-product precursors.
- Food authenticity and safety screening: Discrimination of edible oils (e.g., rapeseed vs. sesame oil) based on native fluorophore fingerprints; quantification of pesticide residues (e.g., carbamates, organophosphates) via quenching or sensitized emission assays.
- Alcoholic beverage authentication: Classification and grading of baijiu (Chinese distilled spirit) by brand, alcohol content (e.g., 46% vs. 56% vol), and aging status using supervised pattern recognition trained on reference EEM libraries.
- Pharmaceutical excipient analysis: Detection of fluorescent impurities in APIs and formulation matrices; stability-indicating assay development for photolabile compounds.
- Biomedical research: Characterization of protein conformational changes, ligand binding events, and enzymatic reaction kinetics via intrinsic tryptophan/tyrosine fluorescence perturbations.
FAQ
What is the primary advantage of 3D fluorescence over conventional single-wavelength fluorescence measurements?
3D fluorescence excitation–emission matrices resolve spectral overlap by spreading signals across two orthogonal wavelength dimensions, enabling unambiguous identification of co-eluting or co-dissolved fluorophores without physical separation.
Can the SmartFluo-Pro perform quantitative analysis without external calibration standards?
While semi-quantitative fingerprinting is possible via similarity matching against reference libraries, regulatory-grade quantification requires matrix-matched calibration curves and method validation per ICH Q2(R2) guidelines.
Is the instrument compatible with fiber-optic probes or flow-through cells?
The standard configuration uses fixed cuvette holders; however, optional fiber-coupled accessories and flow-cell adapters are available upon request for process monitoring or online applications.
How is photometric linearity verified across the dynamic range?
Linearity is assessed using serial dilutions of quinine sulfate under standardized conditions (0.1 mol/L H₂SO₄), with R² ≥ 0.999 expected over three orders of magnitude.
Does the software support PARAFAC or other multi-way decomposition algorithms?
Native software provides basic EEM preprocessing; full PARAFAC modeling requires export to third-party tools such as MATLAB with the N-way Toolbox or Python’s tensorly library.