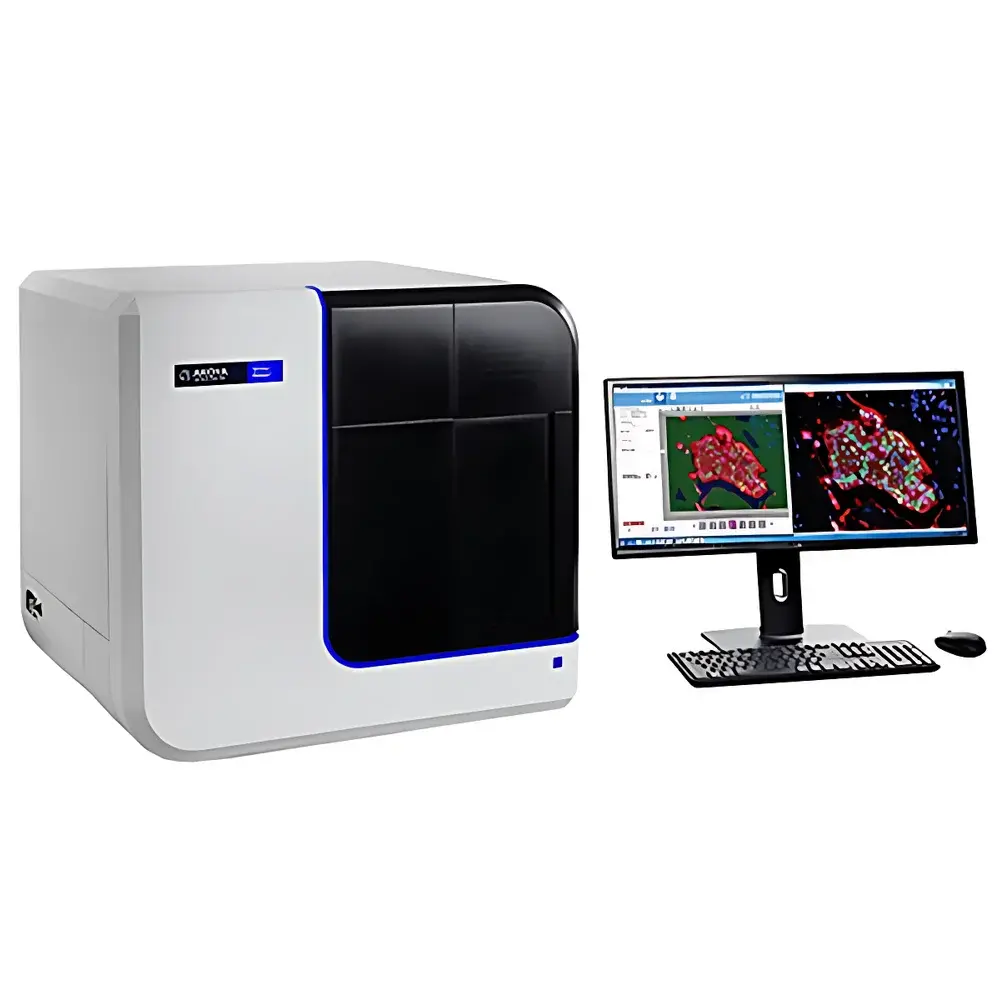
Akoya Vectra Polaris Whole-Slide Multispectral Fluorescence Quantitative Analyzer
| Brand | Akoya |
|---|---|
| Origin | USA |
| Model | Vectra Polaris |
| Imaging Modes | Brightfield & Multispectral Fluorescence |
| Max Multiplexing | 9-Color Fluorescence |
| Scan Speed | Full-slide 7-color fluorescence scan in ≤6 minutes (at 20× objective) |
| Objective Magnifications | 10×, 20×, 40× |
| Autofocus | High-sensitivity adaptive autofocus with Z-stack optimization |
| Excitation | Pulsed LED-based fluorescence excitation |
| Spectral Resolution | <5 nm FWHM |
| Pixel Size (at 20×) | 0.25 µm/pixel |
| Field of View | 1.3 mm × 1.0 mm per frame (20×) |
| Data Output Format | .qptiff (Quantitative Pathology TIFF), .czi, .ome.tiff |
| Software Platform | inForm Advanced Image Analysis Suite v2.7+ |
Overview
The Akoya Vectra Polaris Whole-Slide Multispectral Fluorescence Quantitative Analyzer is an advanced, research-use-only platform engineered for high-fidelity, spatially resolved quantitative analysis of formalin-fixed paraffin-embedded (FFPE) and frozen tissue sections. It integrates multispectral imaging (MSI) with whole-slide digital scanning to decouple spectrally overlapping fluorophores—enabling robust, reproducible quantification of up to nine co-expressed biomarkers within native tissue architecture. Unlike conventional filter-based fluorescence scanners, the Vectra Polaris employs a tunable liquid crystal tunable filter (LCTF) coupled with high-quantum-efficiency sCMOS detection to acquire full spectral stacks (typically 10–30 nm increments across 450–750 nm), followed by linear unmixing algorithms that separate constituent emission signatures with sub-pixel accuracy. This physics-based separation eliminates crosstalk artifacts inherent in sequential single-band acquisition, preserving true signal intensity ratios critical for phenotypic classification and spatial relationship modeling in immuno-oncology, tumor microenvironment (TME) mapping, and biomarker co-localization studies.
Key Features
- Multispectral acquisition engine with <5 nm spectral resolution and hardware-stabilized illumination for consistent spectral fidelity across slides and sessions.
- Automated whole-slide scanning at 10×, 20×, and 40× magnifications—capable of acquiring a complete 7-color fluorescence dataset from a standard 15 mm × 15 mm FFPE section in under six minutes at 20× (including autofocus, tile stitching, and spectral capture).
- Adaptive autofocus system utilizing real-time contrast gradient analysis and Z-stack prediction, ensuring stable focus maintenance across variable tissue thicknesses and uneven mounting media.
- Pulsed LED excitation architecture minimizes photobleaching and thermal drift during prolonged acquisitions—essential for preserving antigen integrity and enabling longitudinal re-scanning of archival specimens.
- Integrated brightfield mode supports H&E and chromogenic IHC co-registration, facilitating direct morphological correlation with multiplex fluorescence data.
- Modular optical path design compliant with ISO 13628-1 (optical performance standards for biomedical imaging systems) and compatible with standard microscope slide formats (75 mm × 25 mm, 1 mm thickness tolerance).
Sample Compatibility & Compliance
The Vectra Polaris supports standard glass slides prepared using conventional immunofluorescence (IF), tyramide signal amplification (TSA), or metal-tagged IMC-compatible protocols. It accommodates both FFPE and cryosections (4–10 µm thickness), as well as cytospin preparations and tissue microarrays (TMAs). All hardware and software components are designed in alignment with Good Laboratory Practice (GLP) documentation requirements. The instrument’s audit trail functionality—including user login timestamps, acquisition parameter logs, and spectral unmixing coefficient records—supports compliance with FDA 21 CFR Part 11 when deployed in regulated environments under appropriate validation protocols. While not CE-IVD or FDA-cleared for diagnostic use, it meets ASTM E2925-22 criteria for analytical validation of quantitative imaging systems used in translational research.
Software & Data Management
Data acquisition and preprocessing are managed via the proprietary inForm Advanced Image Analysis Software (v2.7 or later), which provides end-to-end workflow integration—from spectral unmixing and tissue segmentation to cell phenotyping, spatial statistics (e.g., nearest-neighbor distance, clustering entropy), and relational database export. All raw spectral cubes are stored in open-standard OME-TIFF or vendor-neutral QPTIFF format, ensuring long-term archival integrity and third-party tool interoperability (e.g., QuPath, HALO, Visiopharm). The software includes built-in batch processing, version-controlled analysis templates, and role-based access controls. Audit logs record every parameter change, ROI annotation, and classifier training event—supporting traceability for peer-reviewed publication and internal SOP adherence.
Applications
- Quantitative spatial profiling of immune cell subsets (e.g., CD3+/CD8+/FOXP3+/PD-1+) within tumor nests, invasive margins, and tertiary lymphoid structures.
- Validation and refinement of digital pathology biomarkers for clinical trial enrichment (e.g., PD-L1 heterogeneity scoring, BAP1 loss quantification in mesothelioma).
- Longitudinal assessment of treatment-induced changes in stromal composition, vascular density, and extracellular matrix remodeling.
- Integration with single-cell RNA-seq datasets via spatial transcriptomics correlation pipelines (e.g., Seurat + SPATA).
- Development and verification of AI-driven histopathology models requiring ground-truth multiplex reference annotations.
FAQ
Is the Vectra Polaris FDA-cleared for clinical diagnostics?
No—it is designated for research use only (RUO) and has not received FDA clearance or CE-IVD marking for diagnostic applications.
Can spectral unmixing be performed retrospectively on acquired data?
Yes. Raw spectral cube files (.qptiff or .czi) retain full wavelength-resolved information, allowing reprocessing with updated unmixing libraries or custom reference spectra without rescanning.
What file formats does the system export for downstream analysis?
Primary outputs include QPTIFF (quantitative pathology TIFF), OME-TIFF, and CZI. Cell-level feature tables are exportable as CSV or SQLite for statistical computing environments (R, Python pandas).
Does the platform support integration with laboratory information management systems (LIMS)?
Yes—via RESTful API endpoints and configurable metadata tagging (DICOM-SR compatible headers), enabling bidirectional synchronization with enterprise LIMS platforms compliant with HL7 FHIR R4 standards.
What maintenance and calibration protocols are recommended?
Daily automated flat-field correction and weekly spectral calibration using NIST-traceable reference slides are advised. Annual preventive maintenance includes LCTF spectral alignment verification and sCMOS sensor dark-current profiling.