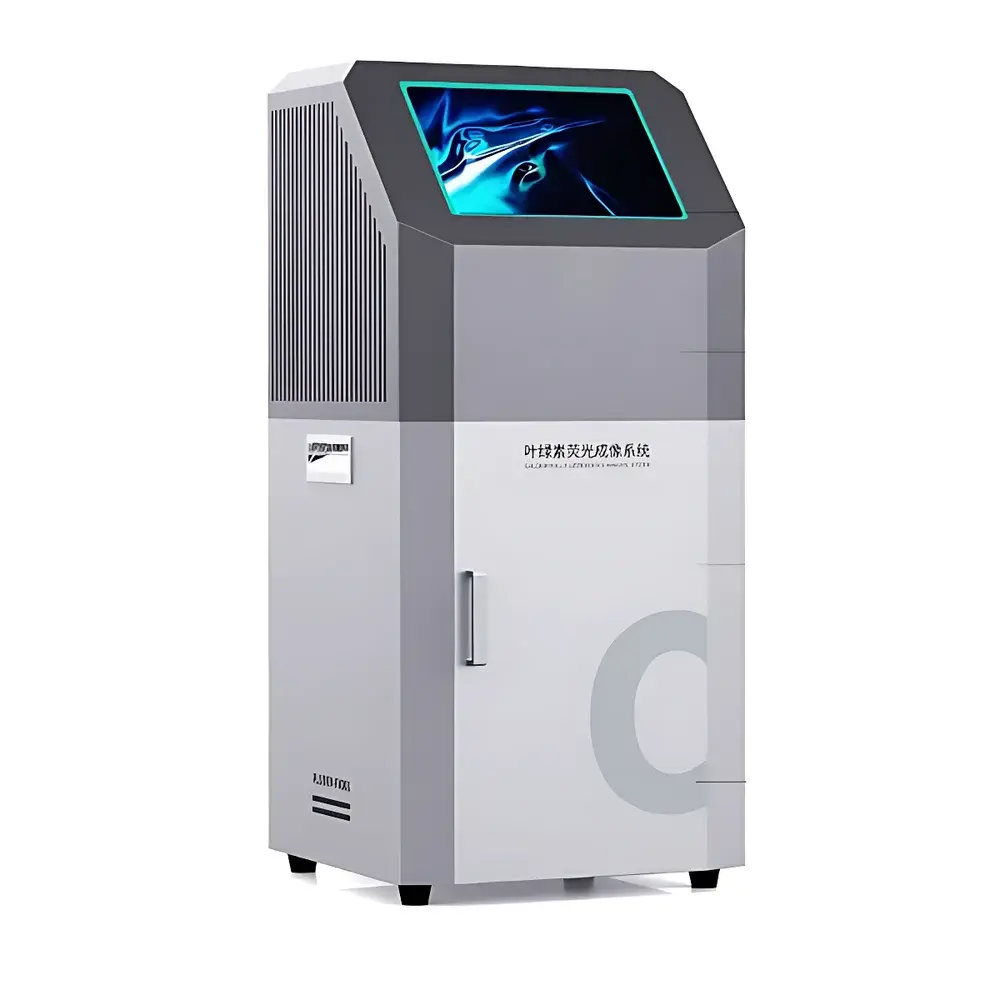
Azure Cloud & Wind Confluence FluorV100 Chlorophyll Fluorescence Imaging System
| Brand | Azure Cloud & Wind Confluence |
|---|---|
| Origin | Jiangsu, China |
| Manufacturer Type | Authorized Distributor |
| Product Origin | Domestic (China) |
| Model | FluorV100 Chlorophyll Fluorescence Imaging System |
| CMOS Resolution | 4096 × 3072 |
| Frame Rate | 150 fps (8-bit), 60 fps (12-bit) |
| Imaging Area | 156 mm × 157 mm (Working Distance = 100 mm) |
| Modulated Actinic Light Intensity | 0.1–100% of 0.1 µmol·m⁻²·s⁻¹ |
| Actinic Light Intensity | 100–800 µmol·m⁻²·s⁻¹ (10–100% adjustable) |
| Saturating Pulse Intensity | 4000 µmol·m⁻²·s⁻¹ (10–100% adjustable) |
| Fluorescence Parameters | Fo, Fm, Fp, Fv, Fm_L[N], Fm_D[N], Fm_Lss, NPQ_L[N], NPQ_D[N], NPQ_Lss, Qp_L[N], Qp_D[N], QYmax, QY_L[N], QY_D[N] |
Overview
The Azure Cloud & Wind Confluence FluorV100 Chlorophyll Fluorescence Imaging System is a high-resolution, quantitative imaging platform engineered for non-invasive, spatially resolved analysis of photosynthetic performance in intact plant tissues. Based on the principles of pulse-amplitude modulation (PAM) fluorometry and kinetic fluorescence imaging, the system captures dynamic chlorophyll a fluorescence responses under precisely controlled light regimes—including modulated measuring light, actinic illumination, and saturating pulses. By converting photochemical quenching (qP), non-photochemical quenching (NPQ), quantum yield (ΦPSII), and other biophysically grounded parameters into pixel-wise maps, the FluorV100 enables researchers to detect early-stage stress responses—such as drought-induced stomatal closure, photoinhibitory damage, nutrient deficiency, or pathogen infection—before visible symptoms manifest. Its design adheres to core biophysical conventions established in the literature (e.g., Kramer et al., Photosynthesis Research, 2004; Maxwell & Johnson, Journal of Experimental Botany, 2000), ensuring compatibility with standardized physiological interpretation frameworks.
Key Features
- High-fidelity 12-bit CMOS sensor with native resolution of 4096 × 3072 pixels, delivering sub-millimeter spatial resolution across a 156 mm × 157 mm field of view at 100 mm working distance
- Dual-mode acquisition: supports both continuous (non-modulated) and PAM-synchronized (modulated) fluorescence imaging protocols
- Programmable light source array with independent control over measuring light (0.1 µmol·m⁻²·s⁻¹ baseline, 10–100% range), actinic light (100–800 µmol·m⁻²·s⁻¹), and saturating pulses (up to 4000 µmol·m⁻²·s⁻¹)
- Real-time frame rates of up to 150 fps (8-bit) and 60 fps (12-bit), enabling capture of rapid fluorescence transients (e.g., OJIP kinetics) and slow-adaptation processes (e.g., NPQ relaxation over minutes)
- Modular software architecture supporting customizable experimental protocols, region-of-interest (ROI) definition, batch processing, and export of raw intensity time series (Ft) alongside derived parameter maps
- Optical path optimized for minimal stray light interference and consistent excitation uniformity—critical for inter-sample comparability in longitudinal or multi-genotype studies
Sample Compatibility & Compliance
The FluorV100 accommodates a broad spectrum of photosynthetic samples, including detached leaves, whole seedlings (Arabidopsis, maize, rice), leaf discs, moss gametophytes, lichens, and microalgal biofilms grown on solid or semi-solid substrates. Sample positioning is facilitated by a motorized XYZ stage (optional upgrade) and integrated LED alignment guides. While not certified to ISO/IEC 17025 or FDA 21 CFR Part 11 out-of-the-box, the system’s data structure—comprising timestamped, metadata-embedded TIFF sequences and CSV-formatted parameter tables—supports integration into GLP-compliant workflows when deployed with validated laboratory information management systems (LIMS). All fluorescence parameters conform to internationally accepted nomenclature (Lazár, Photosynthesis Research, 2015) and are traceable to standard reference measurements using calibrated quantum sensors (e.g., LI-COR LI-190R).
Software & Data Management
The FluorV100 operates with dedicated acquisition and analysis software built on a Qt-based cross-platform framework (Windows/macOS/Linux compatible). The interface provides real-time preview, live parameter mapping (e.g., ΦPSII, NPQ, qP), and synchronized multi-channel logging (fluorescence, actinic intensity, temperature via optional probe input). Data files follow FAIR principles: each experiment generates a self-contained project folder containing raw image stacks (.tiff), protocol definitions (.xml), calibration logs, and processed parameter matrices (.csv). Batch analysis pipelines support automated ROI extraction, normalization against control cohorts, and statistical overlay (e.g., ANOVA heatmaps). Export options include publication-ready TIFF/PNG, MATLAB .mat, and HDF5 formats suitable for machine learning preprocessing. Audit trails—recording user actions, parameter edits, and timestamped file modifications—are configurable to meet internal QA requirements.
Applications
- Phenotyping of abiotic stress tolerance (drought, salinity, heat, cold) in crop breeding programs
- Functional screening of mutant or transgenic lines for altered PSII efficiency or NPQ capacity
- Spatiotemporal mapping of photosynthetic heterogeneity in senescing or infected leaves
- Validation of remote sensing indices (e.g., PRI, NDVI) using ground-truth fluorescence signatures
- Evaluation of foliar fertilizer or biostimulant efficacy through kinetic response profiling
- Ecophysiological studies of understory plants, epiphytes, and bryophytes under variable canopy light environments
FAQ
What is the minimum detectable fluorescence change (ΔF/Fm) supported by the FluorV100?
The system achieves a signal-to-noise ratio (SNR) > 60 dB under standard measurement conditions (Fo acquisition, 12-bit mode), corresponding to a theoretical detection limit of ~0.3% ΔF/Fm. Actual sensitivity depends on sample optical properties and exposure settings.
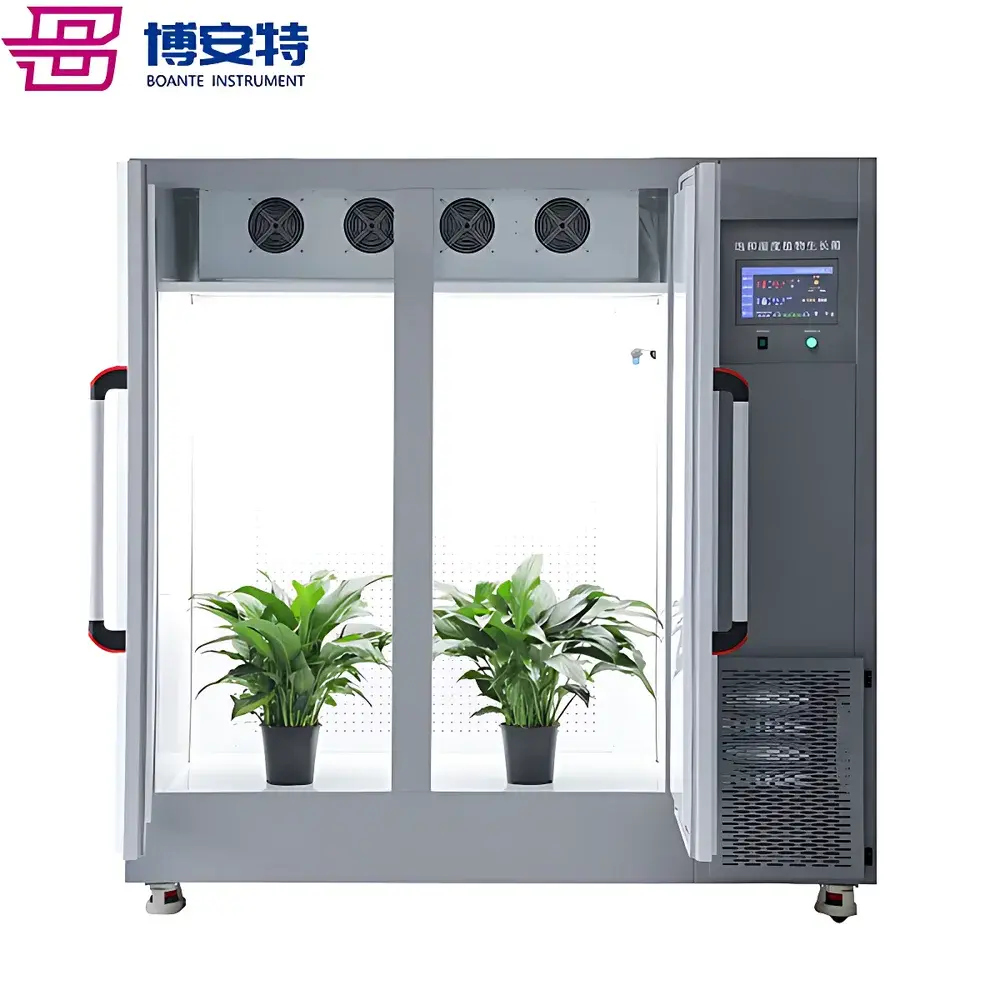
Can the FluorV100 be integrated with environmental growth chambers or climate-controlled phenotyping platforms?
Yes—the system features TTL-trigger I/O ports and Ethernet-based API access (RESTful JSON endpoints), enabling synchronization with chamber controllers (e.g., Conviron, Weiss Technik) for time-stamped acquisition during diurnal cycles or stress ramping protocols.
Does the software support third-party scripting (e.g., Python or MATLAB) for custom analysis?
The FluorV100 SDK provides documented C++ libraries and Python bindings for low-level hardware control and raw data ingestion, allowing integration with SciPy, scikit-image, or PlantCV pipelines.
Is calibration required before each experiment?
A one-time dark adaptation check and white-reference flat-field correction are recommended per session; full radiometric calibration is performed at factory level and documented in the device certificate.
What sample thickness or curvature limits apply for uniform illumination?
For optimal actinic uniformity, samples should present a planar surface within ±1.5 mm deviation across the imaging area. Curved or highly dissected leaves may require localized ROI selection or supplemental collimation optics (available as accessory kit).