COMECAUSE IN|Pheno200 High-Throughput Plant Phenotyping Imaging System
| Brand | COMECAUSE |
|---|---|
| Origin | Shandong, China |
| Manufacturer Type | Original Equipment Manufacturer (OEM) |
| Country of Origin | China |
| Model | IN |
| Price | USD 138,000 (FOB Qingdao) |
| Dimensions | 1500 × 830 × 2140 mm (L×W×H) |
| Max. Plant Height | 300–1000 mm |
| Max. Plant Width | 100–500 mm |
| Max. Fresh Weight | 100–75,000 g |
| Hyperspectral Range | 400–1000 nm |
| Spectral Resolution | <2.5 nm |
| Spectral Bands | 1200 |
| Illumination | Low-flicker, high-CRI halogen light source |
| Camera Resolution | Up to 12 MP |
| Acquisition Time | ≤40 s per plant |
| Analysis Time | ≤30 s per plant |
| 3D Reconstruction | Multi-view stereo photogrammetry with AI-assisted mesh generation |
| Environmental Sensors | Integrated temperature & relative humidity monitoring |
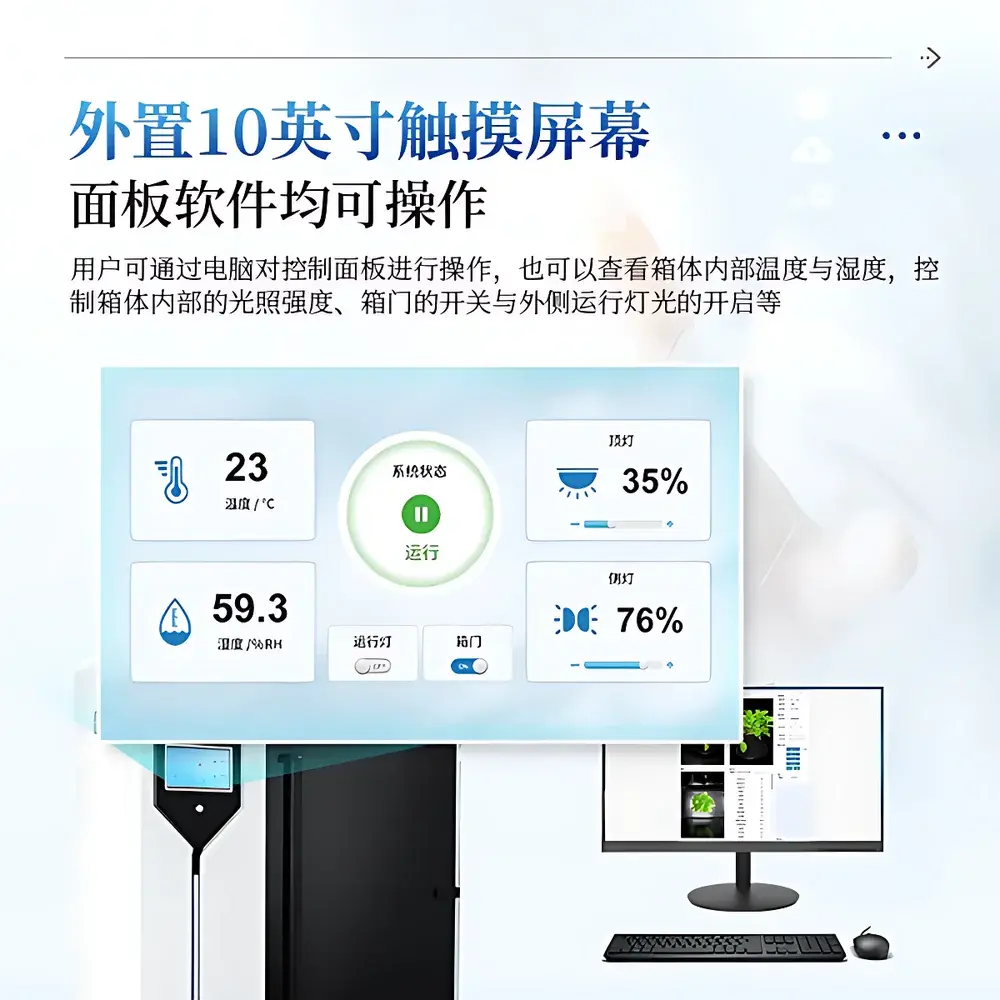
| Control Interface | 10-inch industrial touchscreen + Windows-based desktop software |
| GPU Requirement | NVIDIA GPU ≥8 GB VRAM |
| OS | Windows 10/11 64-bit |
| Data Export | JSON, SPE, TIFF, MP4, CSV, OBJ/PLY (3D model) |
Overview
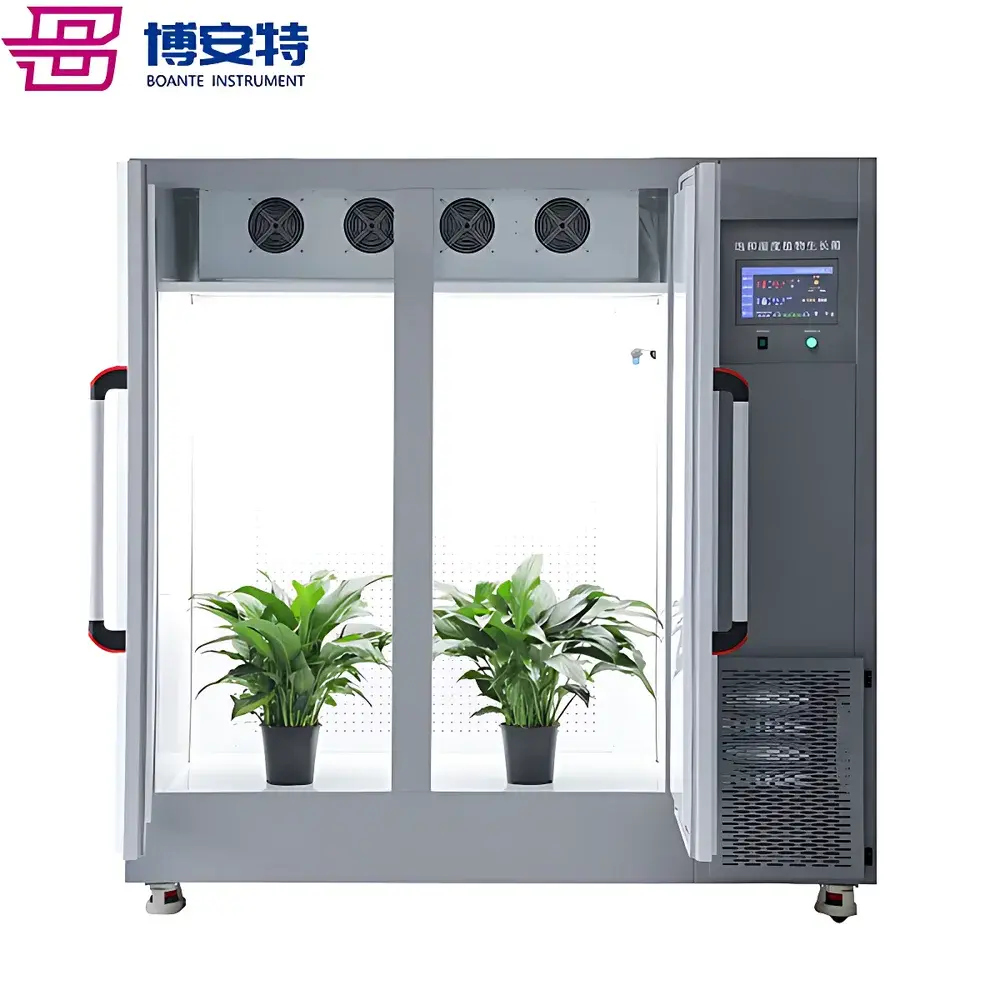
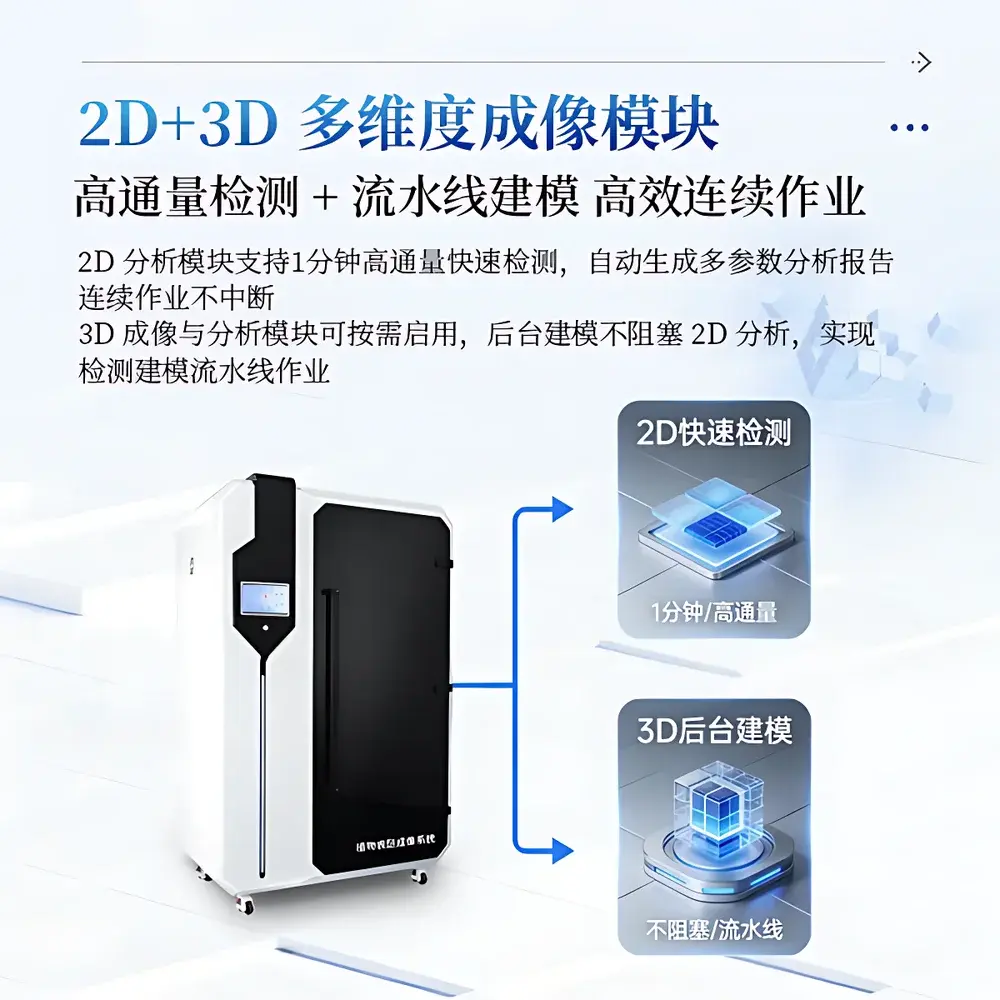
The COMECAUSE IN|Pheno200 is a fully integrated, high-throughput plant phenotyping imaging system engineered for non-destructive, multi-modal, and quantitative assessment of morphological, physiological, and biochemical traits across diverse plant species. Built upon a modular chamber architecture with synchronized multi-angle optical acquisition, the system employs a combination of visible-light (RGB), chlorophyll fluorescence, thermal infrared, and hyperspectral imaging—each calibrated and spatially registered to a common coordinate frame. Its core measurement principle relies on structured photogrammetric reconstruction: by rotating specimens on a precision motorized turntable while capturing images from top, side-above, and side-below positions, the system generates dense point clouds and high-fidelity 3D surface meshes. These geometric models serve as the foundation for extracting over 200 standardized phenotypic descriptors—including structural metrics (e.g., canopy volume, branch angle distribution, skeleton topology), colorimetric parameters (CIE L*a*b*, HSV, grayscale statistics), texture features (GLCM-derived ASM, contrast, entropy, homogeneity), and >58 vegetation and stress indices derived from calibrated hyperspectral reflectance data (400–1000 nm, 1200 bands, <2.5 nm resolution). Designed for longitudinal studies, the IN|Pheno200 supports automated batch processing, cloud-synchronized data archival, and GLP-compliant metadata tagging—enabling reproducible, audit-ready phenotyping workflows in controlled-environment facilities.
Key Features
- Multi-spectral imaging suite: Co-registered RGB, fluorescence (Fv/Fm, NPQ), thermal IR (±0.5°C accuracy), and push-broom hyperspectral cameras (400–1000 nm)
- Automated adaptive imaging: Real-time plant size detection triggers optimal camera positioning, focus, exposure, and image stitching for specimens up to 1 m tall
- AI-accelerated 3D reconstruction: Multi-view stereo matching with deep learning–enhanced depth map refinement; outputs watertight meshes in OBJ/PLY format
- Integrated environmental monitoring: Onboard temperature and RH sensors log chamber conditions with timestamped synchronization to image metadata
- Modular control interface: 10-inch industrial touchscreen for local operation; full remote control via Windows desktop application with role-based access
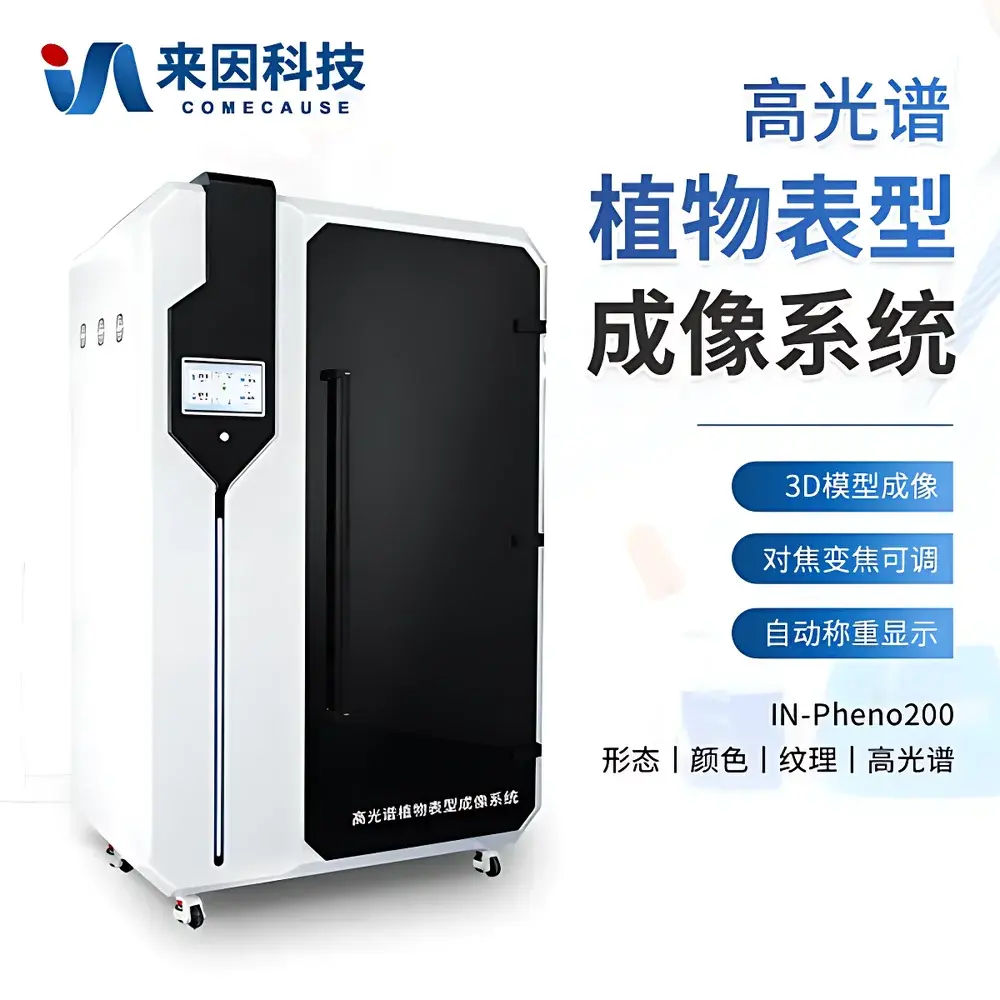
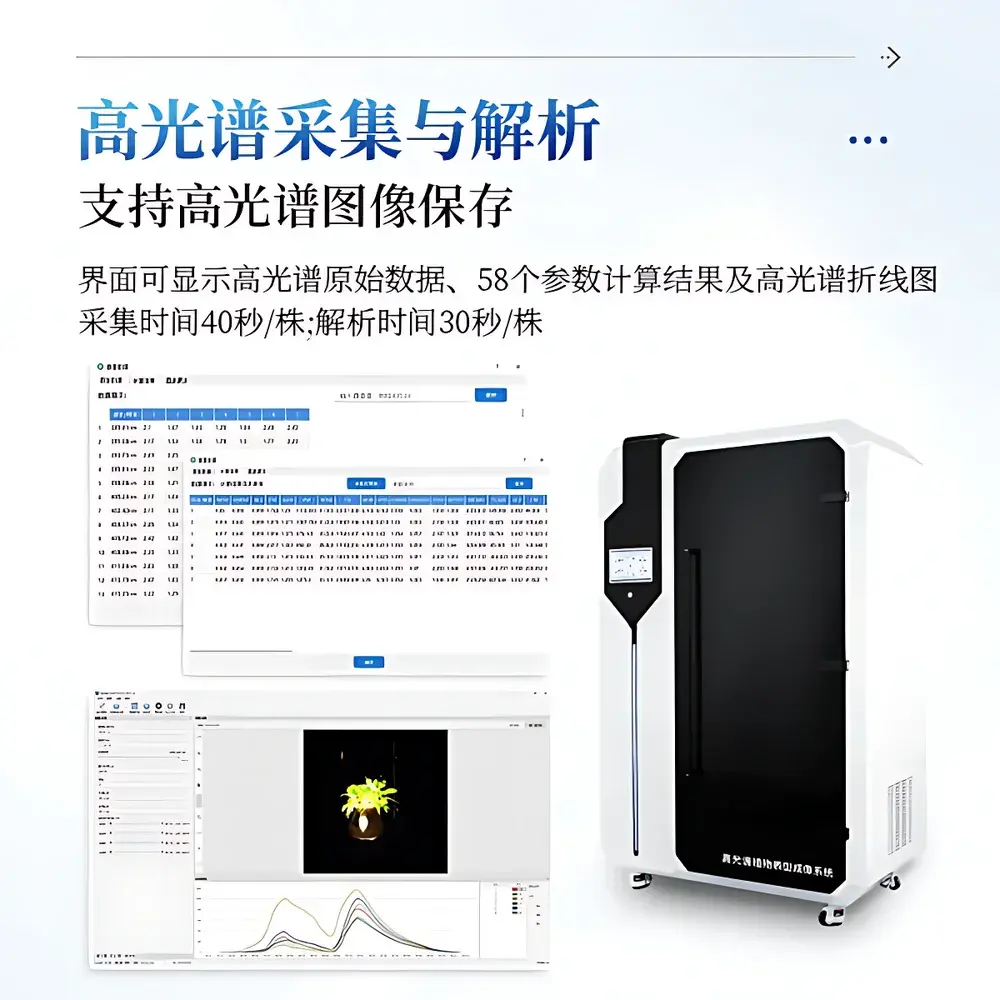
- High-throughput pipeline: 40-second acquisition + 30-second analysis cycle per plant; concurrent 2D screening and background 3D modeling enable continuous throughput
- Comprehensive parameter quantification: Supports 200+ standardized descriptors across morphology, color, texture, and hyperspectral indices (NDVI, PRI, ARI, WI, EVI2, MCARI, etc.)
- Cloud-enabled data management: Encrypted upload to secure SaaS platform with device-specific authentication, version-controlled datasets, and REST API access
Sample Compatibility & Compliance
The IN|Pheno200 accommodates intact, living plants within defined dimensional and mass limits (height: 300–1000 mm; width: 100–500 mm; fresh weight: 100–75,000 g), making it suitable for model species (Arabidopsis, rice, tomato, maize, soybean) and breeding populations across Poaceae, Solanaceae, Brassicaceae, and Fabaceae families. All optical components meet ISO 9022-3:2015 (optical instrument environmental testing) and IEC 61000-6-3:2019 (EMC emission standards). Hyperspectral calibration adheres to ASTM E275-21 (standard practice for describing ultraviolet, visible, and near-infrared spectrophotometers) and NIST-traceable reference standards. Software architecture complies with ALCOA+ principles (Attributable, Legible, Contemporaneous, Original, Accurate, Complete, Consistent, Enduring, Available) and supports 21 CFR Part 11–compliant electronic signatures and audit trails when deployed in regulated environments (e.g., USDA-APHIS, EFSA, or pharmaceutical crop trials).
Software & Data Management
The proprietary Phenosuite™ software (v4.2+) provides a unified interface for instrument control, image acquisition, batch analysis, visualization, and export. It includes: (1) an automated 2D analysis module generating summary reports in <60 seconds per sample; (2) a queued 3D reconstruction engine operating independently of 2D processing; (3) hyperspectral analysis using peer-reviewed algorithms (e.g., Gitelson-Meri, Vogelmann, PSRI) with configurable ROI selection and spectral smoothing; (4) hierarchical data export—CSV for tabular phenotypes, JSON for metadata and computed indices, SPE for raw spectra, TIFF for calibrated reflectance cubes, and MP4/OBJ for 3D model playback and geometry. All data files are embedded with EXIF-like headers containing acquisition time, illumination settings, sensor temperature, and environmental logs. The system supports integration with LIMS platforms via ODBC and exports FAIR-compliant (Findable, Accessible, Interoperable, Reusable) datasets aligned with MIAPPE v1.1 specifications.
Applications
The IN|Pheno200 serves as a foundational platform for hypothesis-driven and discovery-oriented plant science. In quantitative genetics, it enables genome-wide association studies (GWAS) by linking high-resolution phenotypic variance (e.g., NDVI dynamics under drought, thermal heterogeneity during heat stress) to SNP markers across thousands of genotypes. In functional genomics, it supports CRISPR mutant screening through rapid detection of subtle morpho-physiological deviations (e.g., altered stomatal conductance inferred from thermal gradients, photosynthetic efficiency shifts via fluorescence kinetics). For agronomic trait validation, it delivers field-predictive metrics—including canopy architecture indices correlated with lodging resistance, water-use efficiency proxies derived from NIRvP, and pigment ratios predictive of nitrogen status—under controlled conditions prior to field deployment. Additionally, its longitudinal imaging capability supports developmental biology studies, such as quantifying allometric growth trajectories or senescence progression via time-series SSIM and PRI570 decay profiles.
FAQ
What plant species and growth stages are compatible with the IN|Pheno200?
The system is validated for rosette-stage Arabidopsis, vegetative to early reproductive maize and rice, potted tomato and pepper, and young soybean and wheat—within height (300–1000 mm), width (100–500 mm), and weight (100–75,000 g) constraints. Seedlings, mature vegetative plants, and pre-flowering individuals are routinely imaged.
Does the system support external environmental control integration?
Yes—via Modbus TCP or RS-485, the IN|Pheno200 can synchronize with third-party climate chambers (e.g., Conviron, Weiss) to trigger imaging at predefined temperature/humidity setpoints or diurnal cycles.
How is hyperspectral data calibrated and validated?
Each unit undergoes factory calibration using NIST-traceable white reference panels and dark-current correction. Users may perform routine validation using supplied ceramic tiles and liquid-phase standards (e.g., potassium permanganate solution for spectral linearity verification).
Is the 3D model output suitable for biomechanical simulation?
The exported OBJ/PLY meshes include vertex-normal information and are topology-optimized for finite element analysis (FEA); however, material property assignment requires external input (e.g., tissue density, elastic modulus) not measured by the system.
Can the software be deployed on a centralized server for multi-user access?
Yes—Phenosuite™ supports client-server mode with SQL Server or PostgreSQL backends, enabling concurrent access by researchers across departments while enforcing project-level data isolation and permission tiers.
Related Products