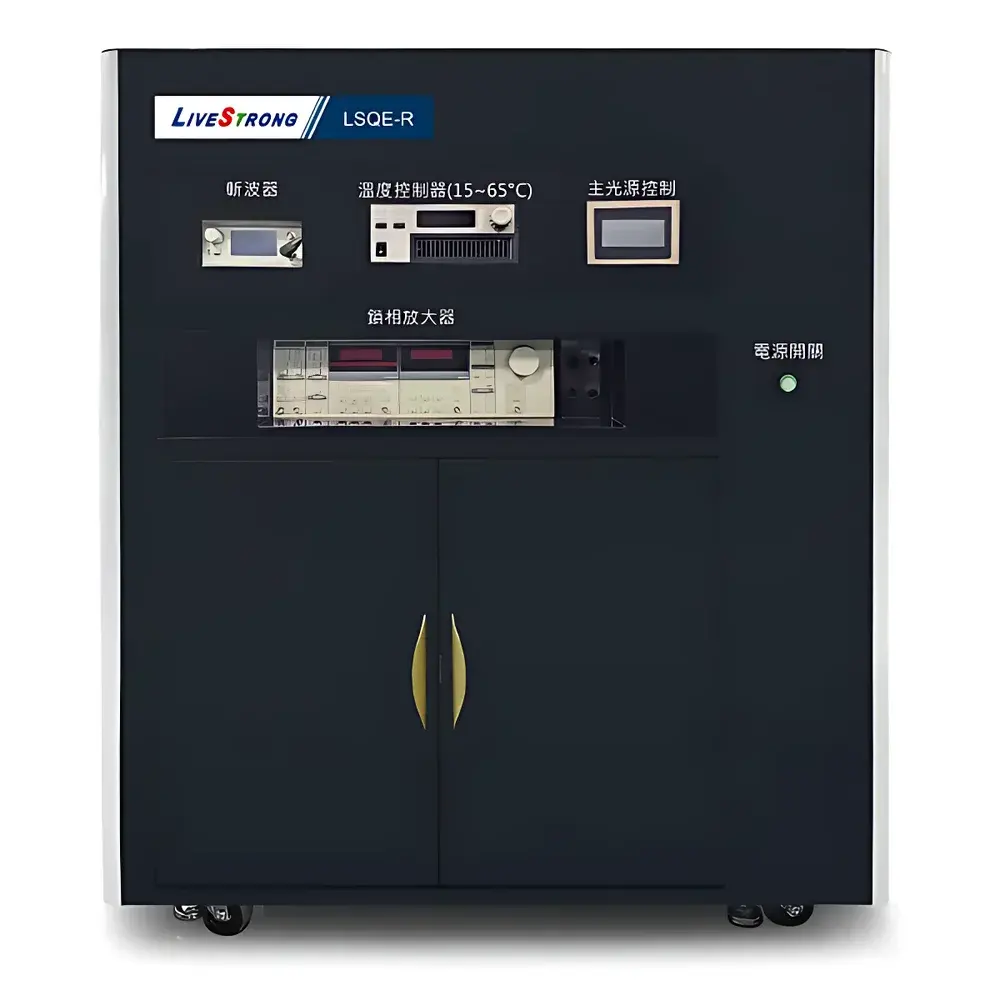
LSQE-R Quantum Efficiency (QE) Measurement System for Solar Cells
| Brand | LiveStrong |
|---|---|
| Model | LSQE-R |
| Origin | Taiwan |
| Instrument Type | Spectral Response & Quantum Efficiency Test System |
| Measurement Principle | AC-coupled Lock-in Amplification with Monochromatic Excitation |
| Wavelength Range | 300–1100 nm (standard), optional extensions to 200–3000 nm |
| Optical Resolution | <0.01 nm (Czerny-Turner monochromator, multi-grating) |
| Stray Light | <1×10⁻⁵ |
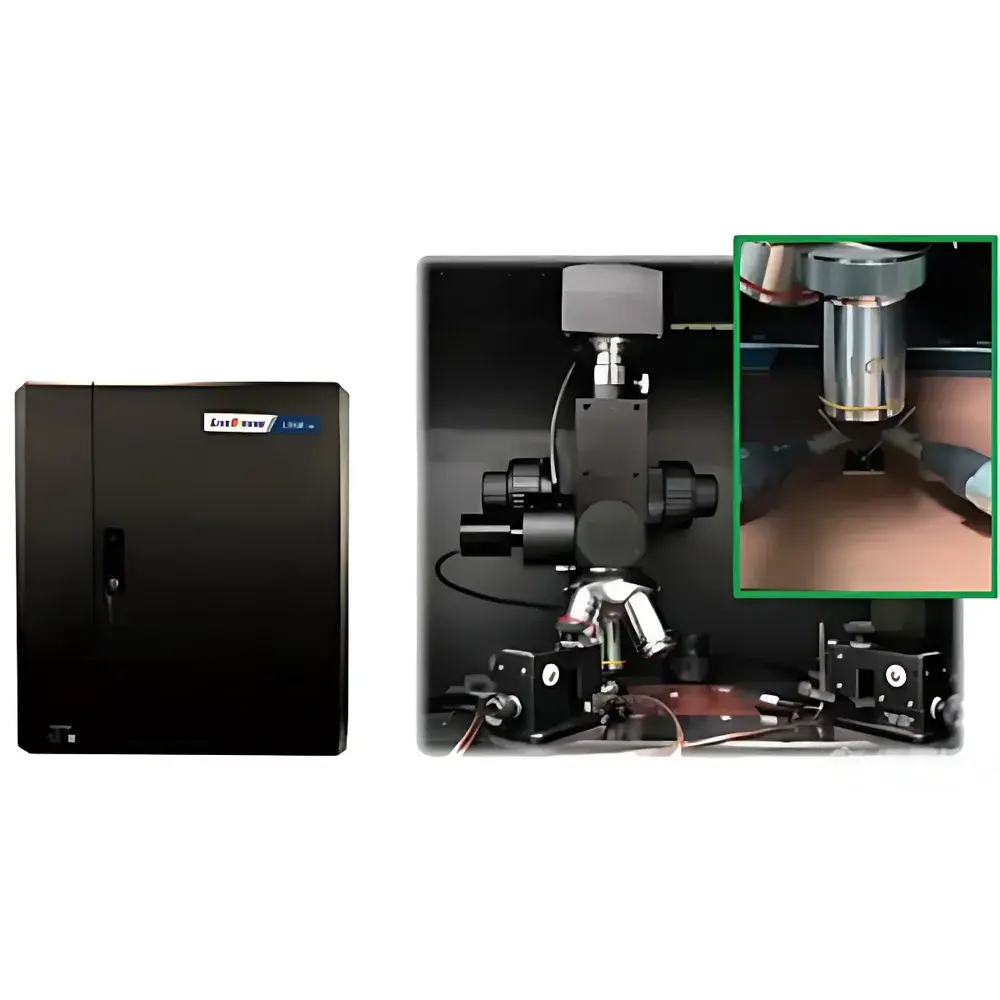
| Spot Size | ~100 µm (with microscope module, adjustable/customizable) |
| Frequency Range | 4 Hz–2 MHz (three selectable bands: 4–200 Hz, 20–2000 kHz, 200–10 kHz) |
| Frequency Resolution | 0.01 Hz |
| Current Sensitivity | 10 fA (AC mode, RMS) |
| Measurement Modes | AC, DC, AC+DC with bias voltage, polarized light collection |
| Compliance | IEC 60904-8, ASTM E1021, ASTM E2848 |
| Key Functions | EQE, IQE, IPCE, spectral responsivity, reflectance, transmittance, Jsc calculation per wavelength, bandgap estimation |
Overview
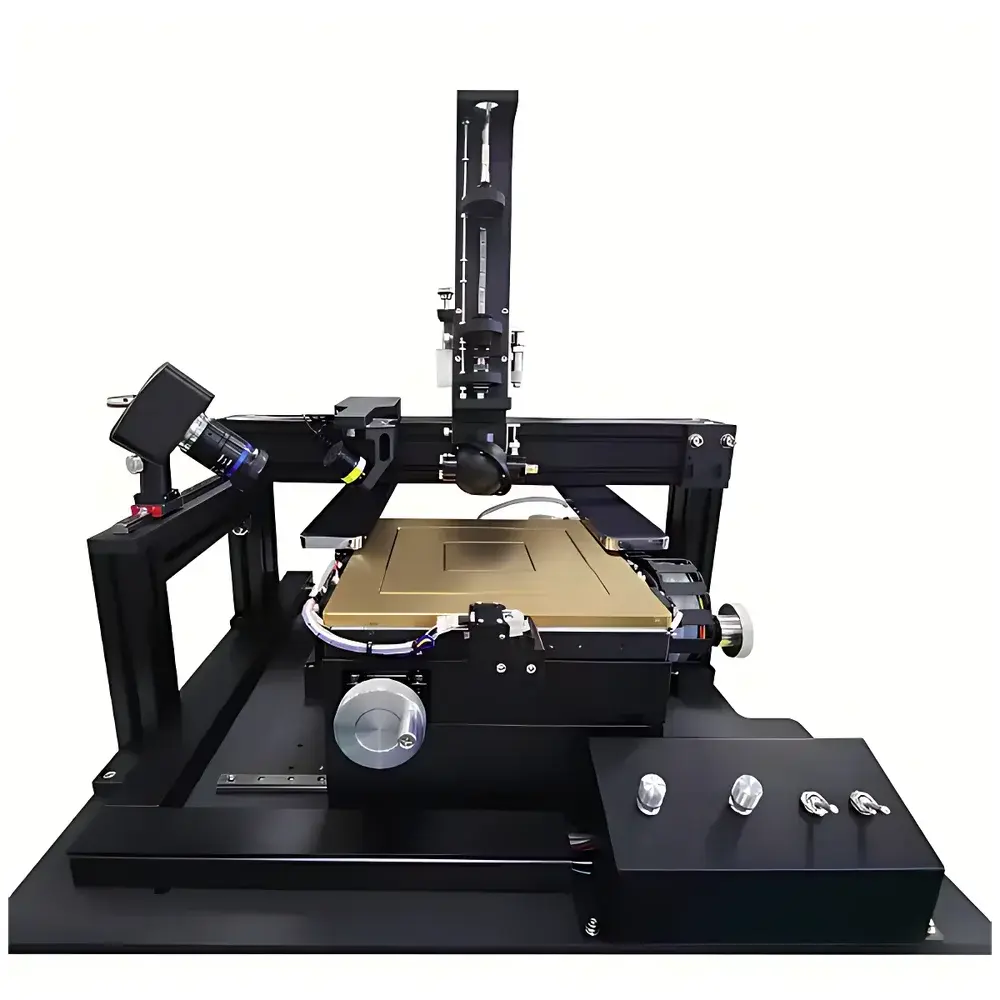
The LSQE-R Quantum Efficiency (QE) Measurement System is an engineered platform for high-fidelity spectral characterization of photovoltaic devices. It operates on the principle of monochromatic photoresponse analysis using lock-in amplification in AC-coupled configuration—optimized to suppress low-frequency noise and enhance signal integrity in weak photocurrent detection. Designed in full compliance with IEC 60904-8 (Photovoltaic devices — Part 8: Measurement of spectral response of a photovoltaic (PV) device) and ASTM E1021 (Standard Test Method for Spectral Responsivity Measurements of Photovoltaic Devices), the system delivers traceable, reproducible quantum efficiency data essential for R&D, process validation, and cell certification workflows. Its core architecture integrates a high-stability Czerny-Turner monochromator with multi-grating selection, enabling precise spectral scanning across 300–1100 nm (standard), with optional wavelength extension modules covering UV (200–400 nm), NIR (1100–1400 nm), SWIR (400–2000 nm), and extended IR up to 3000 nm. The system supports both external quantum efficiency (EQE) and internal quantum efficiency (IQE) determination via synchronized reflectance and transmittance measurements—critical for decoupling optical losses from carrier-generation physics.
Key Features
- AC-mode lock-in detection with 10 fA current resolution (RMS), enabling accurate measurement of ultra-low photocurrents from micro-scale or low-absorption devices
- Three programmable frequency bands (4–200 Hz, 20–2000 kHz, 200–10 kHz) with 0.01 Hz frequency resolution—supporting dynamic response analysis and noise profiling
- Czerny-Turner monochromator with <1×10⁻⁵ stray light suppression and sub-0.01 nm optical resolution, ensuring high spectral fidelity and minimal crosstalk between adjacent wavelengths
- Microscope-coupled optical path delivering diffraction-limited spot sizes down to ~100 µm—enabling spatially resolved QE mapping on heterojunctions, perovskite subcells, or patterned electrodes
- Multi-mode operation: pure AC, DC, AC+DC with programmable forward/reverse bias (±10 V), and polarized-light collection for anisotropic absorber characterization
- Modular hardware design supporting seamless integration of calibrated reference diodes (e.g., NIST-traceable Si, GaAs, Ge), integrating spheres, and environmental chambers
Sample Compatibility & Compliance
The LSQE-R accommodates a broad range of photovoltaic architectures—including silicon (c-Si, mc-Si), III-V multijunction cells, thin-film technologies (CIGS, CdTe), organic photovoltaics (OPV), perovskite solar cells (PSCs), and emerging tandem configurations. Sample holders support standard 25 × 25 mm² to 156 × 156 mm² formats, with vacuum chuck or thermal-stage options for temperature-controlled testing (−40 °C to +85 °C). All measurement protocols adhere to IEC 60904-8 Annex B (calibration traceability), ASTM E2848 (for multi-junction cell spectral mismatch correction), and ISO/IEC 17025 requirements for laboratory competence. Data acquisition complies with GLP audit trails and supports 21 CFR Part 11–ready metadata tagging (user, timestamp, instrument state, calibration ID) when paired with validated software.
Software & Data Management
The native control suite provides real-time spectral acquisition, automated calibration routines (including dark current subtraction, lamp stability monitoring, and grating alignment verification), and integrated IQE derivation via concurrent reflectance/transmittance scans. Export formats include CSV, HDF5, and XML-compliant files compatible with MATLAB, Python (NumPy/Pandas), and PV modeling tools (e.g., PC1D, SCAPS). Raw lock-in outputs (X, Y, R, θ) are preserved for post-processing; spectral responsivity curves are normalized to NIST-traceable reference diodes. Audit logs record all parameter changes, calibration events, and user actions—ensuring full traceability for internal QA or regulatory review.
Applications
- Bandgap extraction and Urbach tail analysis from EQE onset and derivative spectra
- Quantitative loss analysis in tandem stacks via subcell-resolved IQE and reflection-limited current estimation
- Process development feedback for anti-reflection coating optimization, passivation layer evaluation, and emitter doping profiling
- Stability assessment under bias stress or illumination aging by tracking spectral responsivity drift over time
- Validation of simulation inputs (e.g., absorption coefficient α(λ), minority carrier diffusion length) used in TCAD and optical modeling
- Support for interlaboratory round-robin studies under IEA-PVPS Task 12 or EMPIR Metrology for PV frameworks
FAQ
What standards does the LSQE-R comply with for certified QE reporting?
The system implements measurement procedures aligned with IEC 60904-8 Ed. 3.0 (2022), ASTM E1021–21, and ASTM E2848–22. Calibration traceability follows NIST SRM 2500 series reference detectors.
Can the LSQE-R measure IQE without destructive sample preparation?
Yes—IQE is calculated non-destructively by combining simultaneous EQE, reflectance (R), and transmittance (T) measurements: IQE = EQE / (1 − R − T). No etching or layer removal is required.
Is the 10 fA current resolution achievable across the full 300–1100 nm range?
The 10 fA RMS sensitivity is specified under optimal conditions (200 Hz modulation, 1 s time constant, 100 µm spot, Si reference cell). Performance varies with wavelength-dependent quantum yield and optical throughput; system noise floor is characterized per configuration and documented in the factory test report.
Does the software support automated Jsc integration per AM1.5G spectrum?
Yes—the software includes built-in ASTM G173-03 and IEC 60904-3 spectral irradiance tables. Users may select standard spectra or import custom weighting functions for Jsc calculation, uncertainty propagation, and spectral mismatch factor (MMF) derivation.
How is polarization-dependent response measured?
An optional motorized rotating polarizer (extinction ratio >10⁵:1) is mounted in the excitation path, enabling sequential acquisition at defined azimuthal angles (0°–360°, 1° steps) for anisotropy mapping of 2D materials or textured surfaces.