Top Cloud-agri TP-GTL Series High-Throughput Plant Phenotyping Platform
| Brand | Top Cloud-agri |
|---|---|
| Origin | Zhejiang, China |
| Manufacturer Type | OEM Producer |
| Model Variants | TP-GTL-VL2 |
| Imaging Modalities | Visible-light 2D |
| Enclosure Dimensions | 2400 × 2000 × 2500 mm (H×W×D) |
| Conveyor Speed | 0–13 m/min, adjustable |
| Positioning Accuracy | ≤ ±2 mm |
| Tray Capacity | ≤10 pots |
| Max Plant Height | 1.4 m |
| Max Canopy Width | 0.6 m |
| Tray Load Capacity | 50 kg |
| Sensor Interface | Gigabit Ethernet |
| Safety | Emergency Stop, Limit Switches, Fault Alarms |
| Software | Integrated GUI with RFID/QR traceability, AI-powered phenotypic trait extraction, local encrypted storage, audit-ready data logging |
Overview
The Top Cloud-agri TP-GTL Series High-Throughput Plant Phenotyping Platform is an engineered solution for controlled-environment phenomics research in greenhouses and growth chambers. It implements a single-enclosure, multi-sensor architecture based on calibrated optical imaging principles—including 2D visible-light photogrammetry, structured-light or stereo-vision-based 3D surface reconstruction, and push-broom hyperspectral imaging—to quantify morphological, structural, and biochemical plant traits non-destructively and at scale. Designed for longitudinal monitoring of potted plants under standardized environmental conditions, the platform supports reproducible acquisition of time-series phenotypic data aligned to genetic, agronomic, or stress-treatment variables. Its modular sensor configuration enables deployment across diverse experimental objectives—from basic growth dynamics tracking to high-resolution spectral biomarker quantification—while maintaining metrological consistency across acquisitions.
Key Features
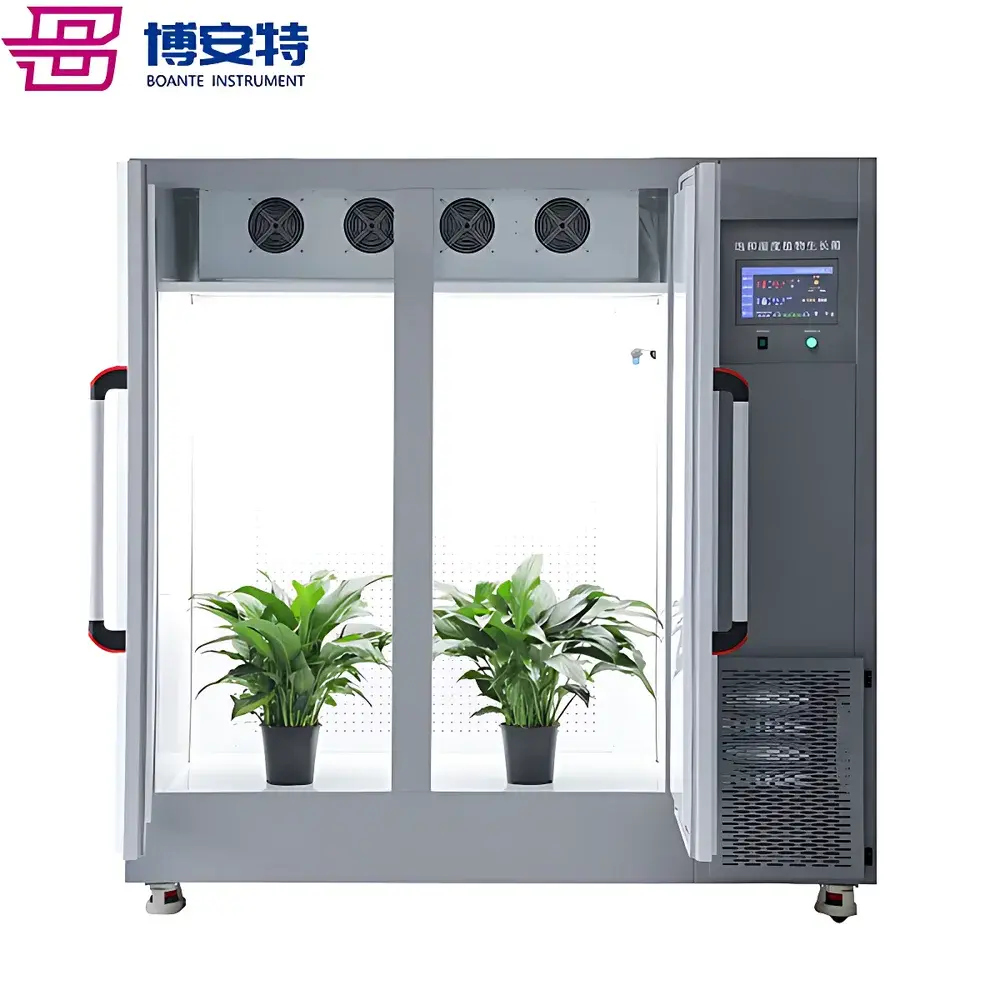
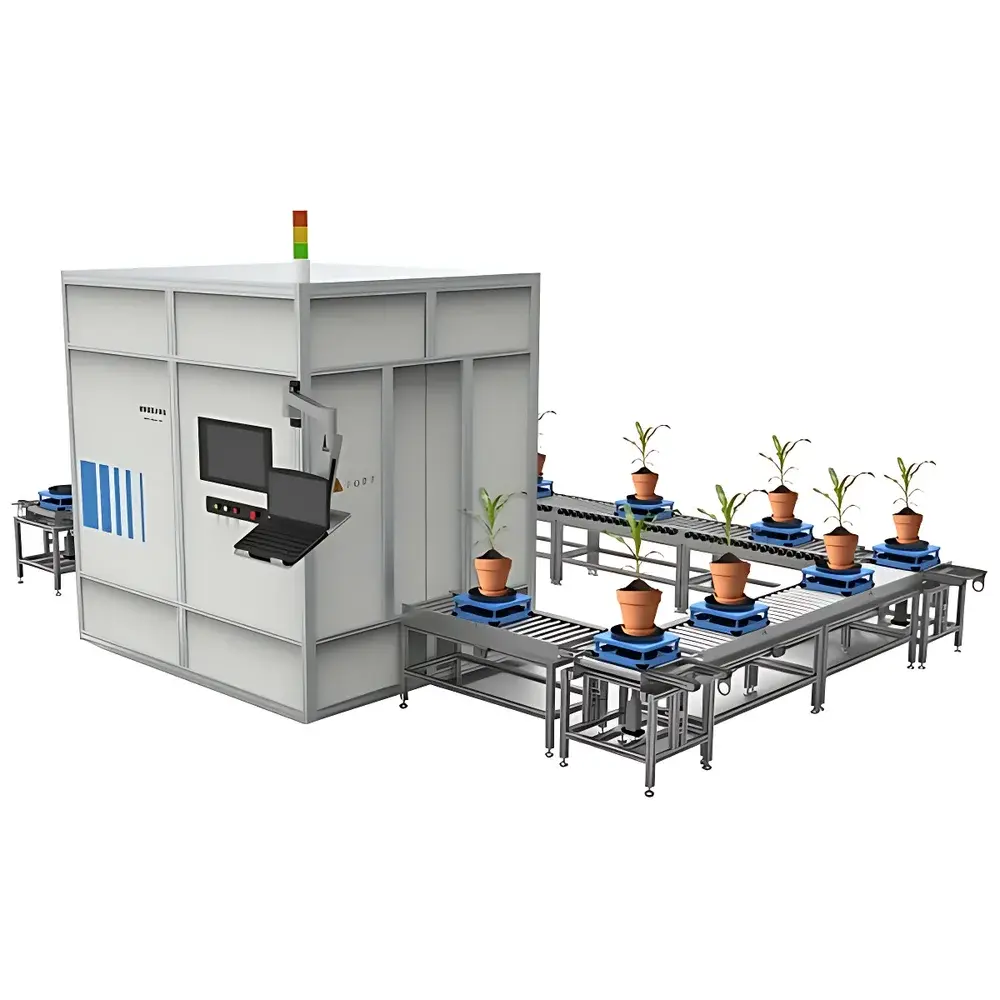
- Integrated Conveyor-Based Workflow: A motorized conveyor system transports standardized plant trays into a light-controlled imaging chamber, enabling synchronized positioning, automated triggering, and sequential multimodal data capture without manual intervention.
- RFID-Enabled Sample Traceability: Each plant tray is tagged with an ISO 15693-compliant RFID label; upon entry into the imaging zone, the system reads the identifier and auto-links all acquired image datasets, metadata, and analytical outputs to the unique sample ID.
- Rotational & Vertical Positioning Module: An internal actuated stage provides programmable 360° rotation and vertical translation (±Z-axis), ensuring full circumferential coverage and optimal viewpoint sampling for robust 3D point cloud generation and spectral uniformity.
- Multi-Modal AI-Powered Trait Extraction: Pre-trained deep learning models—validated on Brassica, Poaceae, Solanaceae, and Fabaceae species—perform automated segmentation, feature detection, and quantitative parameter derivation from raw imagery, including geometric descriptors (e.g., plant height, canopy compactness, leaf angle distribution), colorimetric indices (RHS, RGB ratios), and spectral vegetation indices (NDVI, SR, GVI).
- Extensible Algorithm Framework: The software SDK supports user-defined model integration via ONNX-compatible inference pipelines, allowing researchers to deploy custom CNNs or regression models for species-specific traits such as cabbage “waist thickness”, rice tiller angle, or wheat flag-leaf chlorosis scoring.
- Modular Hardware Architecture: Sensor modules (TP-GTL-VL2, TP-GTL-VL3, TP-GTL-HIPS, TP-GTL-W) are mechanically and electrically decoupled, permitting field-upgradable configurations and minimizing downtime during technology refresh cycles.
Sample Compatibility & Compliance
The platform accommodates standard greenhouse pots (up to Ø30 cm, height ≤1.4 m) mounted on ISO 8601-compliant transport trays. All optical subsystems operate within Class 1 laser safety limits per IEC 60825-1 and comply with CE electromagnetic compatibility directives (2014/30/EU). Image acquisition protocols adhere to FAIR data principles, generating MIAPPE-compliant metadata (Minimum Information About a Plant Phenotyping Experiment). Hyperspectral calibration follows NIST-traceable procedures using certified reflectance standards (e.g., Spectralon®), and spectral data files conform to ENVI .hdr/.dat format specifications. For regulated environments, optional audit trail logging meets GLP requirements (OECD Series 1, Annex V) and supports 21 CFR Part 11-compliant electronic signatures when deployed with validated authentication modules.
Software & Data Management
The unified desktop application—built on Qt6 and Python 3.11—provides role-based access control, task scheduling, real-time preview, batch processing queues, and interactive visualization of 2D/3D overlays and spectral profiles. All raw images, processed point clouds, and derived trait tables are stored in a locally hosted PostgreSQL database with AES-256 encryption at rest and TLS 1.3 in transit. Historical datasets support temporal comparison, statistical outlier detection, and export to CSV, HDF5, or PlantCV-compatible JSON formats. QR code generation integrates with LIMS systems via RESTful API, enabling seamless sample registration and cross-platform data federation. Backup policies enforce incremental snapshots with configurable retention windows and offsite replication readiness.
Applications
- Genotype-by-Environment (G×E) interaction studies in breeding programs
- Quantitative assessment of abiotic stress responses (drought, salinity, heat)
- Early detection and severity grading of foliar pathogens using spectral anomaly detection
- Dynamic modeling of biomass accumulation via integrated optional load cells (±0.1 g resolution)
- Validation of remote sensing algorithms using ground-truthed canopy-level spectral libraries
- Phenotypic anchoring of CRISPR-edited lines through high-temporal-resolution trait trajectories
FAQ
What imaging modalities are supported across TP-GTL variants?
TP-GTL-VL2: Dual-camera 2D visible-light imaging. TP-GTL-VL3: Adds stereo-based 3D reconstruction. TP-GTL-HIPS: Push-broom hyperspectral (400–1000 nm). TP-GTL-W: Full multimodal integration of all three.
Is the system compatible with existing greenhouse infrastructure?
Yes—the platform operates independently of climate control systems and interfaces with common BMS protocols (Modbus TCP, BACnet/IP) for synchronized environmental logging.
How is measurement repeatability ensured across sessions?
Through hardware-level synchronization (PTP IEEE 1588v2), fixed-focus optics with motorized aperture control, and daily automated flat-field correction routines using embedded reference targets.
Can third-party analysis tools be integrated?
Yes—CSV exports, HDF5 binary dumps, and REST API endpoints enable interoperability with R/Bioconductor, Python scikit-learn, or commercial platforms like MATLAB or JMP.
What regulatory documentation is provided for validation purposes?
Factory acceptance test (FAT) reports, IQ/OQ documentation templates, sensor calibration certificates (NIST-traceable where applicable), and software verification records compliant with ISO/IEC 17025 are available upon request.