Top Cloud-agri TP-plant-HIPS High-Resolution Hyperspectral Plant Phenotyping System
| Brand | Top Cloud-agri |
|---|---|
| Origin | Zhejiang, China |
| Manufacturer Type | OEM/ODM Manufacturer |
| Country of Origin | China |
| Model | TP-plant-HIPS |
| Imaging Spectral Range | 400–1000 nm |
| Spectral Bands | ≥1200 |
| Spatial Resolution | Sub-millimeter (at standard imaging distance) |
| Acquisition Time | ≤40 s per potted plant |
| Analysis Time | ≤30 s per plant |
| Power Consumption | <1 kW (typical operational load: ~500 W) |
| Enclosure Dimensions | 1400 × 935 × 1840 mm (L×W×H) |
| Light Source | Low-flicker, high-CRI halogen illumination system |
| Output Formats | Radiance-corrected hyperspectral cubes (.env/.hdr), ROI-exported spectra (.csv), vegetation index maps (GeoTIFF), parametric distribution overlays (PNG/TIFF) |
Overview
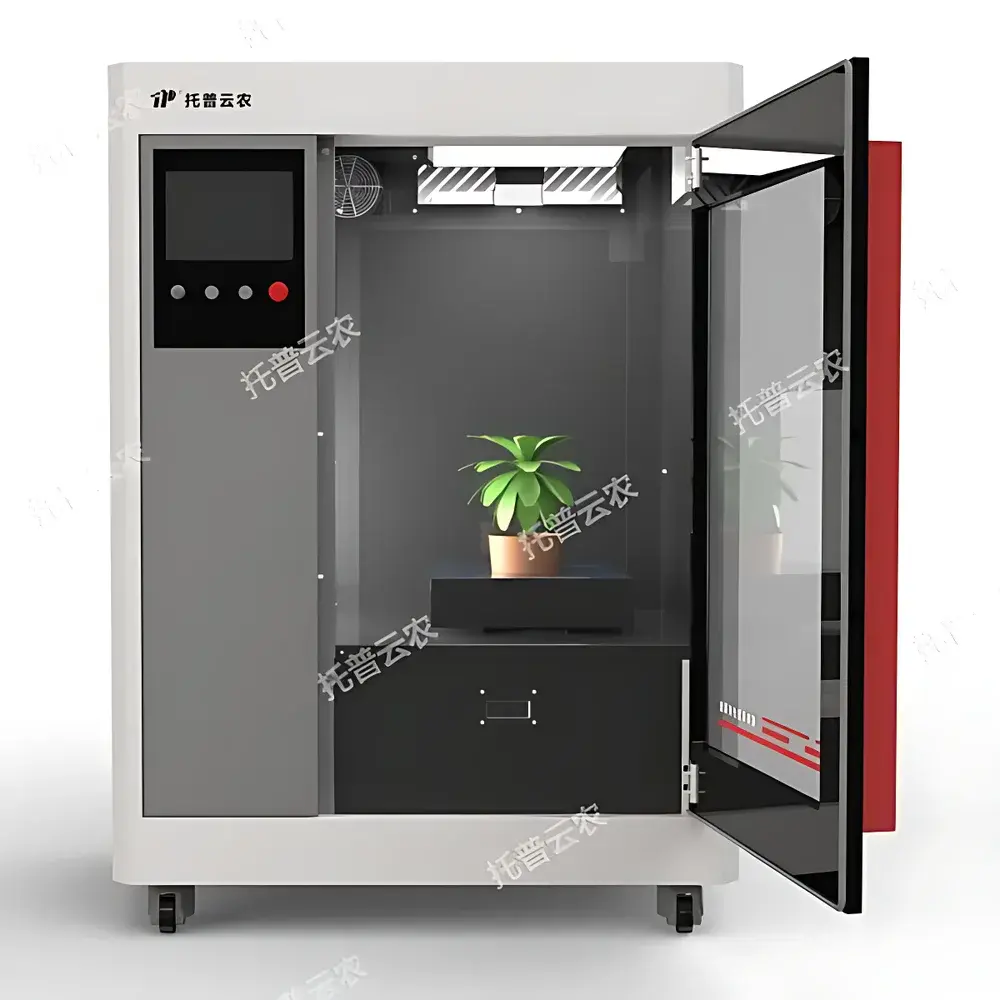
The Top Cloud-agri TP-plant-HIPS is a benchtop, top-view hyperspectral phenotyping system engineered for non-destructive, quantitative analysis of morpho-physiological traits in potted plants under controlled conditions. It operates on the principle of push-broom hyperspectral imaging—capturing contiguous spectral data across 1200+ narrow bands from 400 to 1000 nm—to generate spatially resolved reflectance spectra for each pixel within the field of view. Unlike RGB or multispectral systems, the TP-plant-HIPS enables full spectral curve reconstruction at sub-millimeter spatial resolution, supporting robust inversion modeling of biochemical and biophysical parameters—including chlorophyll concentration, canopy nitrogen content, water band index (WBI), normalized difference vegetation index (NDVI), red-edge chlorophyll index (CCCI), and nitrogen reflectance index (NRI). Its integrated halogen illumination ensures stable, high-color-rendering illumination with minimal temporal flicker, critical for reproducible radiometric calibration across repeated measurements. Designed for laboratory-based phenomics workflows, the system supports standardized acquisition protocols aligned with FAO and Crop Ontology frameworks, facilitating interoperability with downstream genomic and environmental datasets.
Key Features
- Automated vertical scanning stage with programmable height adjustment (±50 mm range) to maintain optimal working distance (300–500 mm) across diverse plant architectures.
- Real-time spectral preprocessing pipeline: dark current subtraction, flat-field correction, and radiometric calibration embedded in firmware.
- Touch-enabled 10.1-inch industrial-grade display with intuitive GUI—enabling one-click acquisition, spectral cube reconstruction, and parameter mapping without command-line interaction.
- QR-code–based sample traceability: each scan links metadata (genotype ID, treatment group, timestamp, operator) directly to hyperspectral data files, ensuring audit-ready provenance for GLP-compliant studies.
- Modular software architecture supporting both out-of-the-box vegetation index computation and user-defined spectral feature extraction via Python API integration.
- Mobile enclosure with casters and vibration-damped base—designed for repositioning between growth chambers, phytotrons, or greenhouse staging areas without recalibration.
Sample Compatibility & Compliance
The TP-plant-HIPS accommodates standard 10–20 cm diameter pots (up to 30 cm height) and is validated for use with monocots (e.g., rice, wheat, maize), dicots (e.g., Arabidopsis, tomato, soybean, Brassica), and perennial herbaceous species. Its spectral response has been verified against NIST-traceable reflectance standards (Spectralon® 99% and 20%) across the 400–1000 nm range. Data output conforms to ENVI header conventions and HDF5-compatible structures, enabling direct ingestion into open-source phenomics platforms such as PhenoImage, PlantCV, and R-based hyperspectral analysis libraries (e.g., hyperSpec, hsdar). While not certified for clinical or diagnostic use, the system meets CE marking requirements for laboratory instrumentation (2014/30/EU EMC Directive and 2014/35/EU LVD Directive) and supports ISO/IEC 17025-aligned documentation practices for method validation in academic and breeding program contexts.
Software & Data Management
The proprietary HIPS-Analyze Suite provides a unified interface for raw data ingestion, spectral normalization, region-of-interest (ROI) definition, index computation, and parametric mapping. All processing steps are logged with timestamps and user IDs; audit trails comply with FDA 21 CFR Part 11 principles for electronic records (though formal validation packages must be implemented locally per institutional SOPs). The software exports calibrated reflectance spectra in CSV format, georeferenced index maps in GeoTIFF, and false-color overlays compatible with QGIS and ArcGIS. For advanced users, a documented RESTful API allows integration with LIMS environments and automated batch processing via scheduled scripts. No cloud storage or external telemetry is enabled by default—data residency remains fully on-premise unless explicitly configured by the end user.
Applications
- Mutation screening: Quantitative discrimination of subtle spectral shifts associated with chlorophyll biosynthesis mutants (e.g., ch1, clb) or nitrogen assimilation defects using CCCI and NRI gradients.
- Abiotic stress phenotyping: Temporal tracking of WBI decline under drought, NDVI suppression during heat exposure, and red-edge inflection point shifts under salinity stress.
- Disease progression modeling: Pixel-wise classification of early-stage fungal infection (e.g., Botrytis, Pseudomonas) via spectral angle mapper (SAM) comparison against healthy tissue templates.
- Nutrient use efficiency (NUE) assessment: Correlation of canopy-level nitrogen index maps with destructive Kjeldahl assays across fertilizer gradient trials.
- High-throughput germplasm evaluation: Integration with robotic pot handlers for unattended sequential scanning of >50 genotypes/day under standardized lighting and geometry.
FAQ
Does the TP-plant-HIPS require external calibration standards for routine operation?
No—factory-applied radiometric calibration is stored in device firmware and applied automatically during acquisition. However, periodic verification using supplied Spectralon® reference panels is recommended every 6 months or after major optical maintenance.
Can the system operate inside growth chambers with limited headroom?
Yes—the minimum clearance required is 1900 mm; the enclosure height is 1840 mm, leaving 60 mm for cable management and airflow. Optional low-profile lighting kits are available for constrained-height environments.
Is spectral data export compatible with MATLAB or Python-based analysis pipelines?
Yes—hyperspectral cubes are exported in ENVI format (.hdr/.env) and HDF5, both natively supported by SciPy, scikit-image, and the hyperspy library. Sample Jupyter notebooks for vegetation index derivation are provided with software installation.
What level of technical support is included post-purchase?
Top Cloud-agri provides remote diagnostics, firmware updates, and application engineering consultation for the first 12 months. Extended hardware warranty and on-site service contracts are available upon request.
Are there restrictions on plant size or growth stage for reliable measurement?
Optimal performance is achieved with vegetative-stage plants occupying 60–90% of the field of view. Fully expanded rosettes (e.g., mature Arabidopsis) and early tillering cereals are routinely imaged; flowering or lodging stages may require custom ROI masking to exclude non-canopy elements.
Related Products