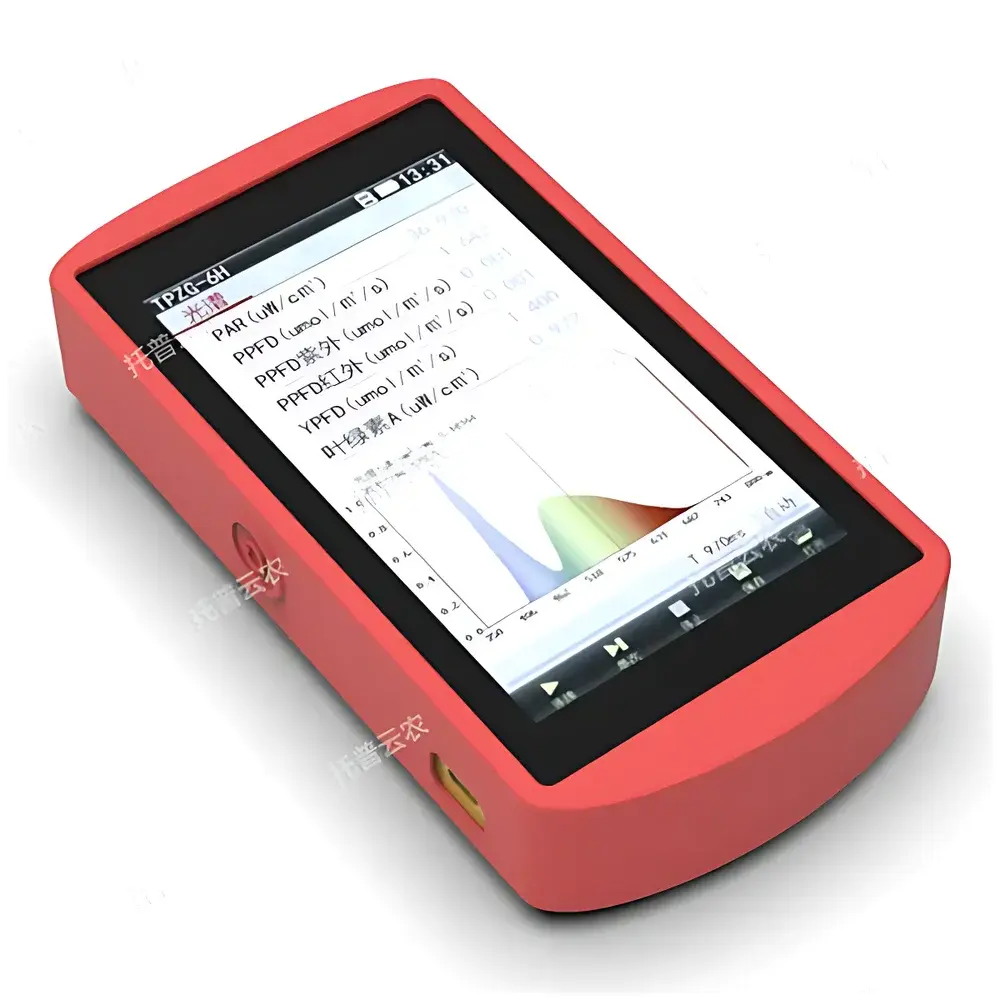
Top Cloud-agri TPZG-6H Handheld Plant Spectroradiometer
| Brand | Top Cloud-agri |
|---|---|
| Origin | Zhejiang, China |
| Manufacturer Type | OEM/ODM Manufacturer |
| Country of Origin | China |
| Model | TPZG-6H |
| Spectral Range | 350–800 nm |
| CCD Sensor Type | High-Precision Linear CCD |
| Spectral Bandwidth (FWHM) | 2 nm |
| Spectral Resolution / Repeatability | 0.2 nm |
| Wavelength Accuracy | ±0.5 nm |
| Illuminance Accuracy | Class I (±4% of reading ±1 digit) |
| Chromaticity Coordinate Accuracy | ±0.0025 (traceable to NIM-standard stable source, drift <±0.0005) |
| Correlated Color Temperature (CCT) Range | 1,000 K – 100,000 K |
| Stray Light | ≤0.3% |
| Illuminance Measurement Range | 5 lx – 200 klx |
| Integration Time | 50 µs – 10,000 ms |
| Display | 5.0-inch HD capacitive touchscreen |
| Data Export | Micro USB interface |
| Storage | Pre-installed 8 GB microSD card |
| Power | Rechargeable Li-ion battery |
| Operating Temp./RH | −10 °C to +40 °C, <70% RH (non-condensing) |
| Storage Temp./RH | −20 °C to +45 °C, <70% RH (non-condensing) |
| Dimensions / Weight | 138.5 × 81 × 23 mm / ~430 g (with battery, no accessories) |
Overview
The Top Cloud-agri TPZG-6H Handheld Plant Spectroradiometer is a field-deployable, high-fidelity optical measurement instrument engineered for quantitative spectral characterization of horticultural light sources and ambient plant-growing environments. Based on linear CCD array detection with 2 nm full-width-at-half-maximum (FWHM) spectral bandwidth, the device operates across the biologically critical 350–800 nm range—encompassing ultraviolet-A (UV-A), photosynthetically active radiation (PAR: 400–700 nm), and near-infrared (NIR) regions. It delivers calibrated radiometric and photometric outputs—including photosynthetic photon flux density (PPFD), chlorophyll-weighted irradiance (Y(λ)), red:blue irradiance ratio (R:B), and CIE 1931/1960/1976 chromaticity coordinates—enabling objective evaluation of spectral quality in controlled-environment agriculture (CEA), tissue culture labs, greenhouse optimization studies, and plant phenotyping workflows.
Key Features
- 5.0-inch high-resolution capacitive touchscreen with 180° rotation support, adjustable brightness, and hardware-accelerated screenshot capture
- Real-time spectral distribution visualization (350–800 nm) with point-and-read wavelength-specific irradiance values
- Comprehensive parameter output: PAR (400–700 nm), PPFD (µmol·m⁻²·s⁻¹), illuminance (lx), CCT (K), dominant/center wavelength (nm), CRI (Ra), Duv, color rendering fidelity metrics (Rf, Rg), and spectral power distribution (SPD) integrals per band (UV, blue, green, red, FR, NIR)
- Built-in CIE standard chromaticity diagrams (1931 xy, 1960 u’v’, 1976 u’v’) with Δu’v’ color difference mapping and MacAdam ellipse-based tolerance analysis
- Dual-language UI (English & Simplified/Traditional Chinese) compliant with international lab documentation standards
- Micro USB host-mode interface enabling direct U-disk data export; dual-format logging (.csv for spreadsheet interoperability, .ohs for advanced spectral reconstruction via Top Cloud-agri SpectraView software)
Sample Compatibility & Compliance
The TPZG-6H is designed for non-contact measurement of planar or diffuse light sources—including LED grow lamps, fluorescent tubes, metal halide fixtures, natural daylight, and canopy-reflected radiation—without requiring optical fiber coupling or external integrating spheres. Its cosine-corrected input optic ensures angular response compliance with CIE S 023/E:2013 and ISO/CIE 19476:2014 for irradiance measurement. Calibration traceability is maintained to China’s National Institute of Metrology (NIM) reference standards, with chromaticity coordinate uncertainty certified at ±0.0025 under stabilized thermal conditions. The instrument meets electromagnetic compatibility (EMC) requirements per GB/T 18268.1–2010 (equivalent to IEC 61326-1) and environmental robustness per IEC 60529 IP54 for dust and splash resistance. While not FDA 21 CFR Part 11-certified out-of-box, audit-ready data logs (timestamped, user-ID tagged, immutable .csv exports) support GLP/GMP-aligned experimental recordkeeping when deployed within validated laboratory SOPs.
Software & Data Management
Data acquisition and post-processing are supported by Top Cloud-agri SpectraView desktop software (Windows/macOS), which enables spectral normalization, comparative overlay of up to eight measurements, PAR-weighted action spectrum convolution (e.g., McCree curve, EN 12464-1), and automated report generation compliant with ISO/IEC 17025 documentation templates. Raw .ohs files retain full spectral resolution (1 nm step, 350–800 nm), while .csv exports provide tabularized integrals and derived metrics suitable for integration into LIMS or statistical platforms (R, Python pandas, JMP). Firmware updates are delivered via microSD card or USB, ensuring long-term protocol adaptability without hardware modification.
Applications
- LED grow light spectral validation and binning verification prior to deployment in vertical farms
- Dynamic PAR mapping across multi-tier hydroponic racks to identify irradiance gradients and optimize lamp placement
- Quantitative assessment of spectral shift in aging horticultural LEDs (e.g., blue pump degradation, phosphor thermal quenching)
- Correlation of spectral metrics (e.g., R:B, far-red fraction) with morphological endpoints in photomorphogenesis studies
- Calibration transfer between reference spectroradiometers and production-line photometers in lamp manufacturing QA
- Field validation of spectral transmission through greenhouse glazing materials (polycarbonate, ETFE, glass)
FAQ
What spectral calibration standards does the TPZG-6H reference?
The instrument is factory-calibrated against NIM-traceable tungsten-halogen and deuterium lamp standards, with wavelength accuracy verified using atomic emission lines (Hg, Ne) and irradiance calibrated via a NIM-certified silicon photodiode.
Can the TPZG-6H measure reflected spectra from plant canopies?
Yes—when used with its optional cosine diffuser and held at standardized height/distance (per ISO 21348), it provides repeatable reflectance-relative SPD estimates; absolute reflectance requires concurrent incident irradiance measurement with a second unit or calibrated reference panel.
Is spectral data export compatible with third-party analysis tools?
All .csv outputs conform to ASTM E308-22 column naming conventions, enabling direct ingestion into MATLAB, Python (specutils), or commercial lighting design software (AGi32, Dialux)
How is measurement repeatability ensured across temperature fluctuations?
Internal thermal stabilization circuitry maintains sensor junction temperature within ±0.5 °C over the operating range; spectral drift compensation algorithms are applied in real time using onboard thermistor feedback.
Does the device support batch measurement mode for time-series monitoring?
Yes—programmable auto-trigger intervals (1 s to 24 h) allow unattended logging to microSD, with timestamps synchronized to internal RTC (±2 s/month accuracy).
")