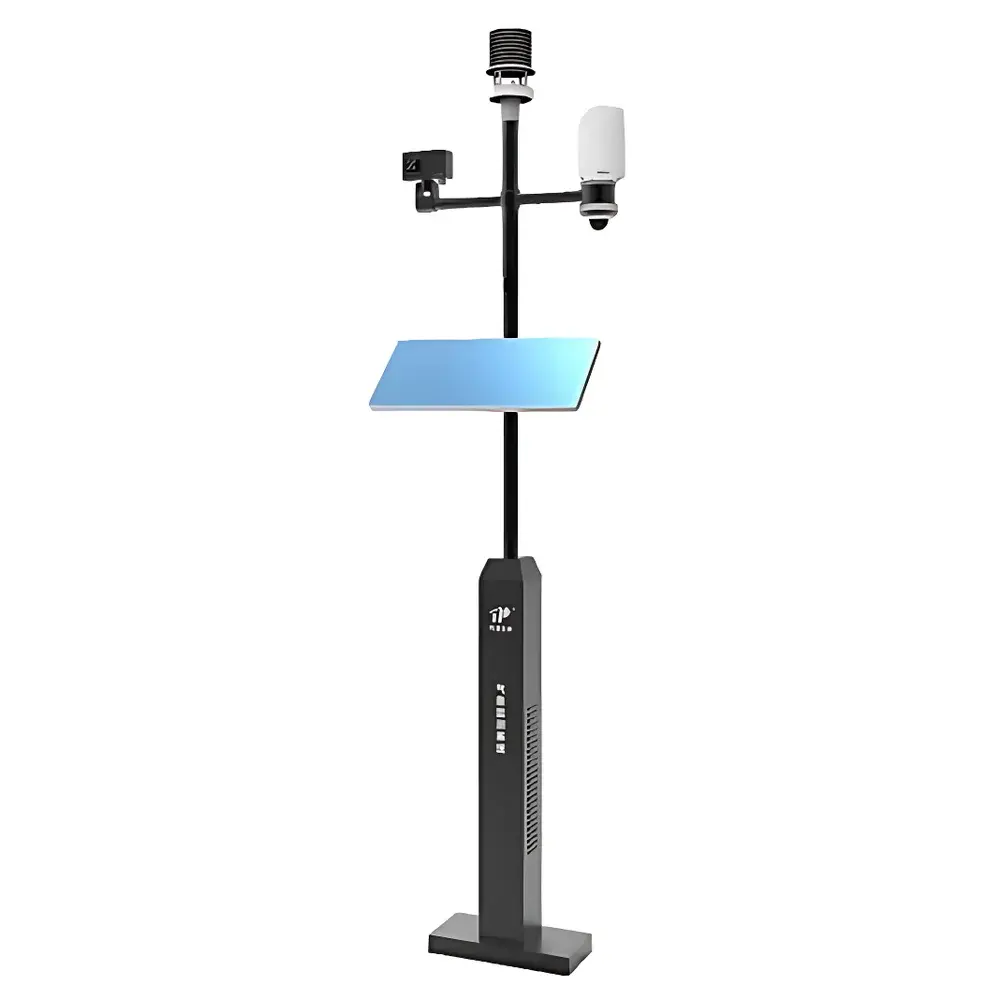
Top Cloud-agri TP-WMS-PHY Plant Phenotyping IoT Monitoring System
| Brand | Top Cloud-agri |
|---|---|
| Origin | Zhejiang, China |
| Manufacturer Type | Original Equipment Manufacturer (OEM/ODM) |
| Country of Origin | China |
| Model | TP-WMS-PHY |
| Pricing | Available upon Request |
Overview
The Top Cloud-agri TP-WMS-PHY Plant Phenotyping IoT Monitoring System is a field-deployable, sensor-integrated phenotyping platform engineered for high-temporal-resolution, non-destructive monitoring of plant morphological, physiological, and environmental dynamics. It operates on the principle of multi-spectral reflectance imaging combined with in situ microclimate and edaphic sensing, enabling quantitative extraction of canopy-level biophysical traits—such as chlorophyll content, canopy structure, water status, and phenological stage—through standardized spectral indices. Designed for longitudinal studies across breeding nurseries, experimental farms, and ecological transects, the system bridges the gap between genotype-to-phenotype mapping and real-world agronomic conditions by delivering time-series trait data synchronized with environmental drivers (e.g., PAR, VPD, soil moisture tension). Its architecture adheres to FAO’s CropWatch framework for scalable agro-ecological monitoring and supports integration into national phenomics infrastructure initiatives aligned with CGIAR and EU-EPPN standards.
Key Features
- Continuous,无人值守 (unattended) 24/7 data acquisition via solar-powered, low-power embedded nodes with dual-mode telemetry (4G LTE + LoRaWAN fallback)
- Integrated multi-spectral imager (5-band: 550 nm, 660 nm, 730 nm, 780 nm, 850 nm) with 12-bit radiometric resolution and automated exposure control for NDVI, GNDVI, NDRE, OSAVI, and LCI derivation
- Multi-parameter environmental sensor suite: air temperature (±0.2°C), relative humidity (±2% RH), photosynthetically active radiation (PAR, 400–700 nm, ±5%), precipitation (tipping-bucket, 0.2 mm resolution), wind speed/direction (ultrasonic anemometer), and soil profile measurements (temperature, volumetric water content, and electrical conductivity at 10 cm, 20 cm, and 30 cm depths)
- Onboard GPS/GLONASS module with sub-5 m positional accuracy and automatic altitude registration; tamper-detection logic triggers alerts upon unauthorized relocation
- Edge-computing capability for real-time index computation and anomaly flagging prior to cloud upload, reducing bandwidth dependency and ensuring data integrity under intermittent connectivity
Sample Compatibility & Compliance
The TP-WMS-PHY is validated for deployment across diverse plant systems—including cereal crops (wheat, rice, maize), legumes (soybean, pea), horticultural species (tomato, lettuce), and perennial grasses—under both controlled-environment (greenhouse, growth chamber) and open-field conditions. Sensor calibration traceability follows ISO/IEC 17025 guidelines, with factory-certified verification against NIST-traceable reference standards for spectral irradiance and thermohygrometric parameters. The system complies with IEC 60529 (IP66 enclosure rating), RoHS Directive 2011/65/EU, and EMC Directive 2014/30/EU. Data handling protocols align with GDPR-compliant metadata tagging and support audit-ready export formats (CSV, NetCDF, GeoJSON) required for GLP-aligned field trials and USDA-ARS reporting frameworks.
Software & Data Management
The proprietary TopCloud Phenotype Analytics Platform (v3.2+) provides role-based web and mobile access (iOS/Android) for visualization, batch trait extraction, and cross-site comparison. All raw and processed data are stored in encrypted, ISO 27001-certified cloud infrastructure with immutable versioning and full audit trail (user actions, timestamped parameter edits, firmware updates). The platform supports FDA 21 CFR Part 11–compliant electronic signatures for trial documentation and offers RESTful API integration with third-party LIMS (e.g., LabVantage, Thermo Fisher SampleManager) and breeding management systems (e.g., BreedBase, T3). Time-series analytics include auto-detected phenophase transitions (emergence, tillering, flowering, senescence), water deficit stress scoring, and correlation heatmaps linking spectral indices to soil moisture depletion curves.
Applications
- High-throughput phenotyping in forward and reverse genetics programs targeting drought tolerance, nitrogen use efficiency, or disease resistance loci
- Field validation of UAV- and satellite-derived vegetation indices through ground-truth anchoring at plot level
- Dynamic irrigation scheduling based on real-time canopy conductance proxies derived from NDVI–VPD coupling models
- Long-term ecological monitoring of phenological shifts in response to climate variability (e.g., spring advancement, autumn delay)
- Preclinical evaluation of agrochemical efficacy via temporal tracking of lesion development, chlorosis progression, or recovery kinetics post-treatment
FAQ
What spectral bands does the multi-spectral imager cover, and are they factory-calibrated?
The imager captures five discrete bands centered at 550 nm (green), 660 nm (red), 730 nm (red edge), 780 nm (near-infrared edge), and 850 nm (near-infrared). Each band undergoes factory radiometric calibration using NIST-traceable integrating sphere sources and is delivered with per-pixel dark current and flat-field correction matrices.
Can the system operate autonomously during extended power outages?
Yes. Equipped with a 50 Ah LiFePO₄ battery and 40 W monocrystalline solar panel, the system sustains continuous operation for ≥14 days without sunlight, with adaptive sampling frequency reduction to preserve critical data continuity.
Is raw image data accessible for custom algorithm development?
Yes. Full-resolution TIFF and RAW binary files (16-bit, radiometrically corrected) are available via secure SFTP or direct SD card download, accompanied by EXIF metadata including GPS coordinates, UTC timestamps, and sensor orientation angles.
Does the platform support integration with genomic data pipelines?
Yes. The API supports bidirectional synchronization with genomic databases via MIAPPE-compliant JSON-LD schemas, enabling genotype-phenotype association analysis within Galaxy or R/Bioconductor workflows.
What is the recommended maintenance interval for field-deployed units?
Biannual field verification is advised: optical window cleaning, sensor drift check against reference standards, and firmware update validation. A certified service technician performs Level-3 diagnostics annually per ISO 5725-2 precision verification protocol.