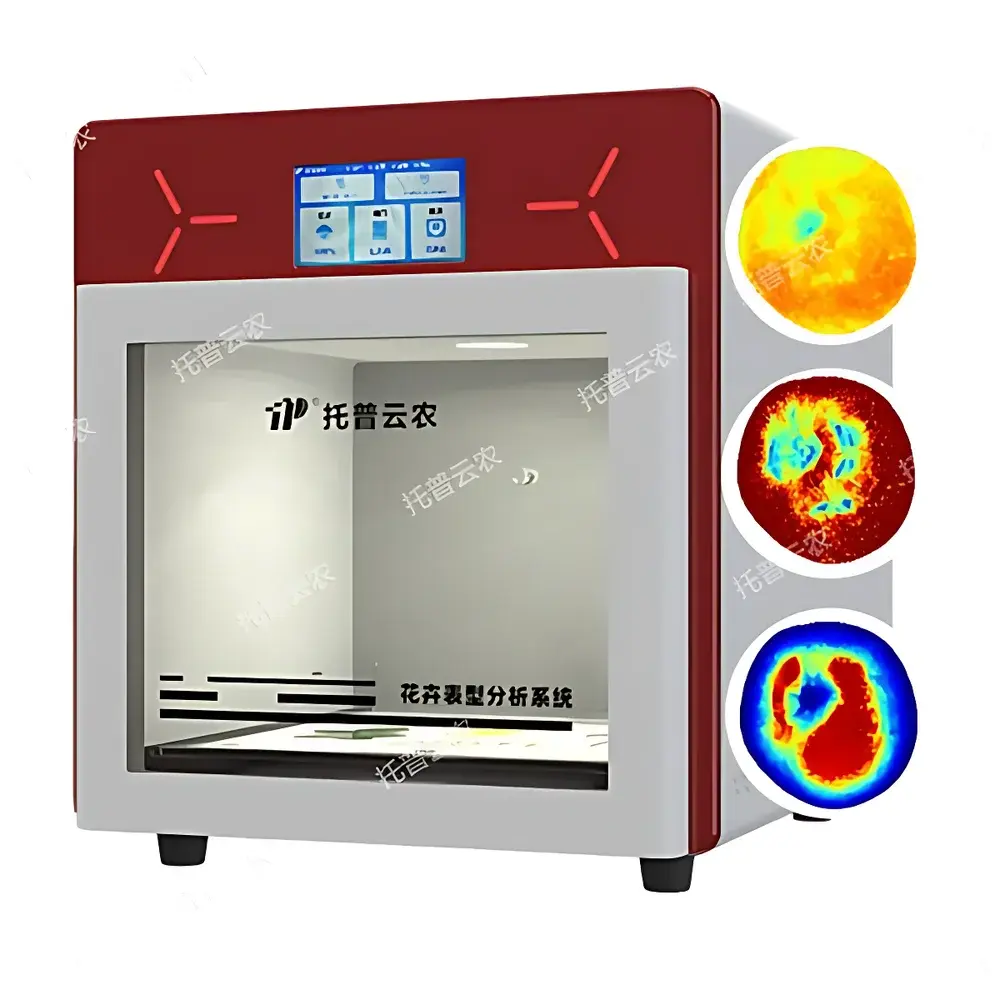
Top Cloud-agri TP-GP-GS Non-Destructive Fruit Quality Analyzer with Hyperspectral Imaging
| Brand | Top Cloud-agri |
|---|---|
| Origin | Zhejiang, China |
| Manufacturer Type | Direct Manufacturer |
| Region of Origin | Domestic (China) |
| Model | TP-GP-GS |
| Pricing | Upon Request |
| Visible Light Imaging | 26-MP Industrial RGB Camera, Uniform Diffuse LED Illumination |
| Hyperspectral Range | 400–1000 nm |
| Background Plate | 450 × 450 mm |
| Integrated Scale | 0.1 g Resolution, 3 kg Capacity, Auto-Tare & Zero |
| Power Supply | AC 220 V, 50 Hz |
| Max Power Consumption | <100 W |
| Operating Temperature | 0–40 °C |
| Relative Humidity | ≤90% RH |
Overview
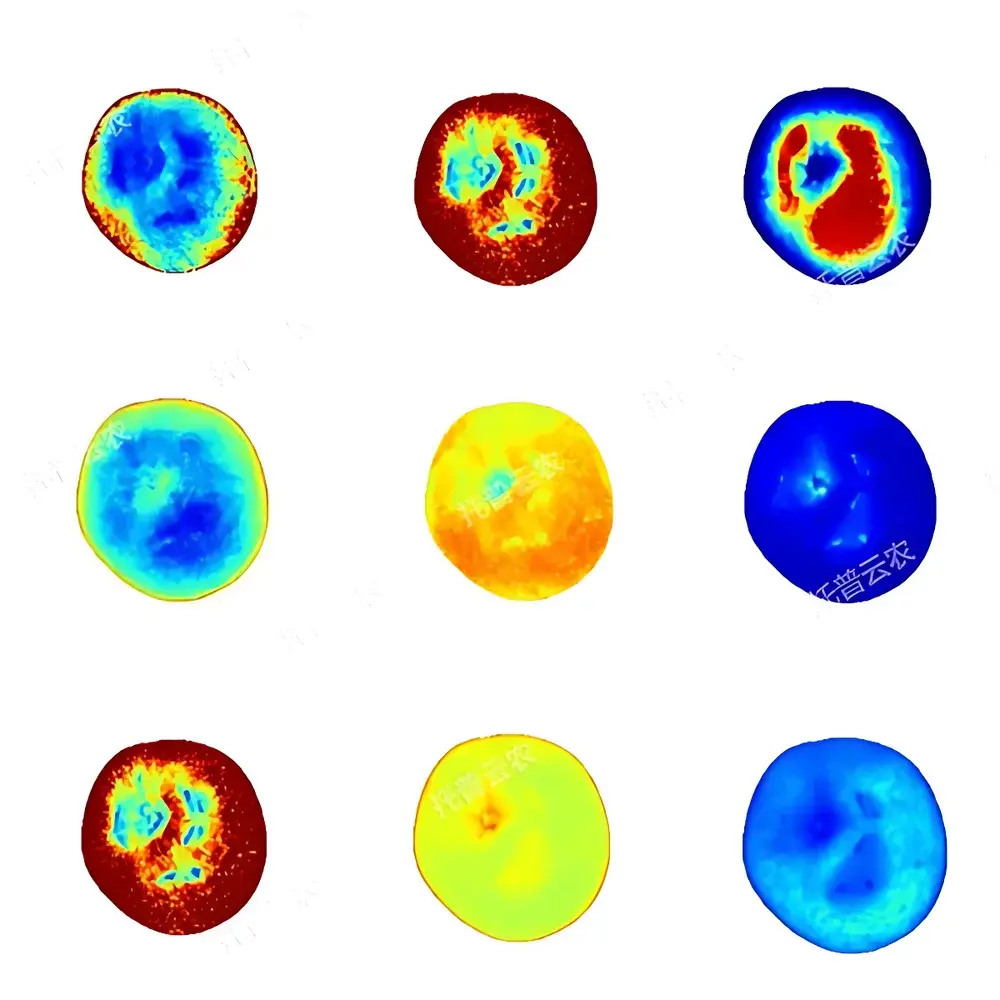
The Top Cloud-agri TP-GP-GS Non-Destructive Fruit Quality Analyzer with Hyperspectral Imaging is a laboratory-grade plant phenotyping system engineered for quantitative, non-invasive assessment of internal and external fruit quality traits. Leveraging push-broom hyperspectral imaging in the visible–near-infrared (VNIR) spectral range (400–1000 nm), coupled with high-resolution RGB imaging and integrated precision weighing, the system captures spatially resolved spectral signatures from intact fruit surfaces. These signatures are processed using chemometric calibration models—developed and validated against reference biochemical assays—to predict internal compositional parameters including soluble solids content (SSC, expressed as °Brix), titratable acidity (TA), moisture distribution, and physiological maturity indices. Unlike destructive sampling or single-point refractometry, this system enables full-surface, pixel-level mapping of quality heterogeneity—critical for breeding programs, postharvest physiology research, and process validation in controlled-environment agriculture.
Key Features
- Integrated Multimodal Imaging Platform: Combines synchronized VNIR hyperspectral imaging (400–1000 nm, 5–10 nm spectral resolution typical for push-broom systems) with 26-megapixel RGB imaging under uniform diffuse LED illumination—eliminating shadow artifacts and ensuring radiometric consistency across samples.
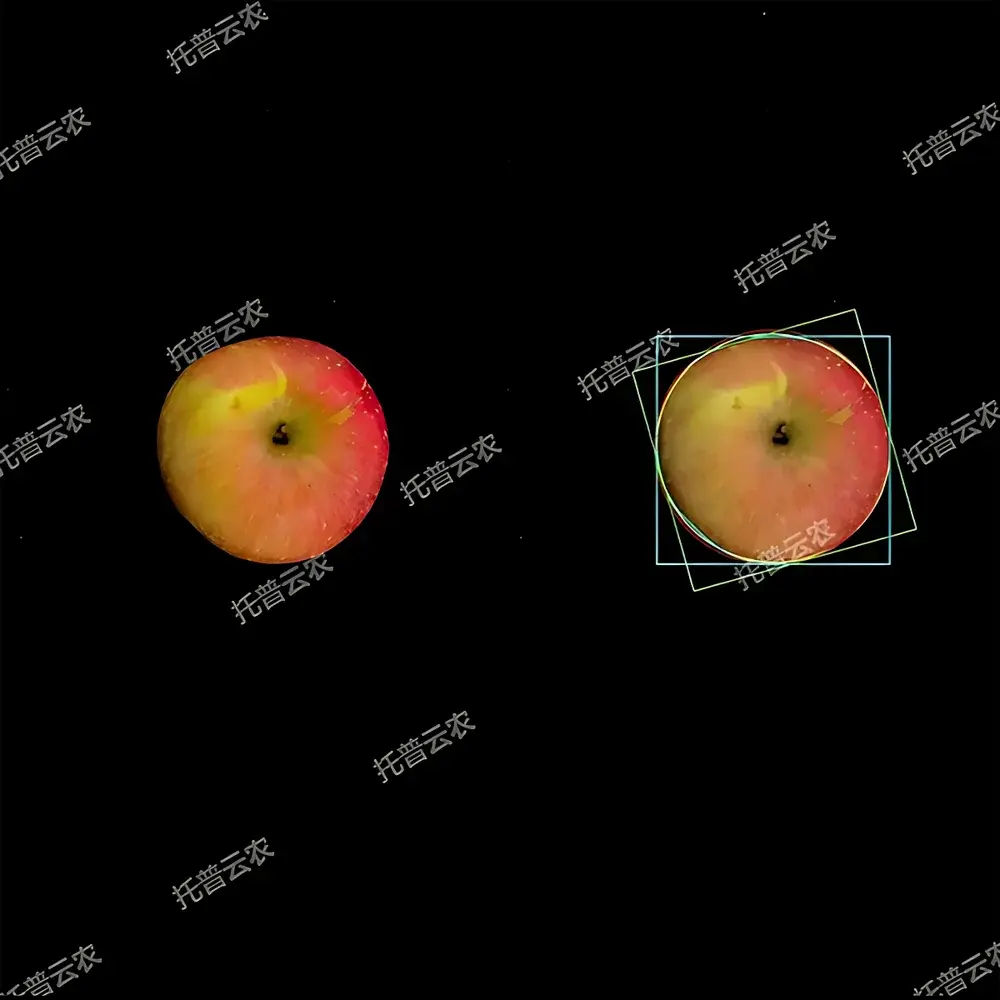
- Automated Morphological Phenotyping: Proprietary computer vision algorithms perform real-time segmentation and geometric quantification—including fruit diameter, length, width, perimeter, projected area, surface color (CIELAB L*a*b*), and count—within ≤3 seconds per sample.
- Non-Destructive Internal Quality Prediction: Pre-loaded, instrument-specific PLSR and SVM regression models translate spectral reflectance profiles into quantitative estimates of SSC, TA, water content, and maturity stage—calibrated using ground-truth data from standard laboratory methods (e.g., AOAC 975.33 for °Brix, titration for TA).
- Built-in Precision Weighing Module: Integrated load cell (0.1 g resolution, 3 kg capacity) automatically records mass during image acquisition; tare and zero functions ensure repeatability across sequential measurements.
- Modular Sample Handling: Sliding sample tray with standardized positioning guides ensures reproducible fruit orientation and minimizes operator-induced variability—essential for longitudinal studies and multi-site trials.
- Metadata-Rich Image Management: Each acquired image is auto-tagged with timestamp, sample ID, acquisition parameters, and weight metadata; manual annotation fields support experimental context (e.g., cultivar, harvest date, storage duration).
Sample Compatibility & Compliance
The TP-GP-GS supports intact, uncut fruit specimens ranging from small berries (≥20 mm diameter) to large pome and citrus fruits (≤120 mm). Tested compatibility includes Malus domestica (apple), Pyrus pyrifolia (Asian pear), Citrus reticulata (mandarin), Solanum lycopersicum (tomato), and Prunus persica (peach). The system operates within ISO/IEC 17025-aligned laboratory environments and supports GLP-compliant workflows through audit-trail-enabled software logging. While not FDA 21 CFR Part 11-certified out-of-the-box, raw spectral data (in ENVI-compatible .hdr/.raw format) and analysis logs are exportable for integration into validated LIMS or electronic lab notebook (ELN) platforms.
Software & Data Management
The proprietary analysis suite provides a GUI-driven workflow: image import → auto-segmentation → spectral extraction → model-based prediction → statistical summarization. Batch processing supports queued analysis of hundreds of images with user-defined output templates. All processed data—including pixel-level maps, region-of-interest (ROI) statistics, and trend charts—are exportable in CSV, Excel, and PDF formats. Cloud synchronization (via secure HTTPS endpoint) enables centralized data aggregation across distributed research sites. Raw hyperspectral cubes retain full spectral fidelity for reprocessing with updated models or third-party chemometric tools (e.g., Unscrambler X, MATLAB).
Applications
- Quantitative trait locus (QTL) mapping and marker-assisted selection in fruit breeding programs
- Postharvest physiology studies: tracking temporal changes in SSC, acid metabolism, and water loss during cold storage or CA treatment
- Validation of non-destructive sorting algorithms for commercial packing lines
- Phenotypic screening of germplasm collections under controlled environment conditions (growth chambers, greenhouses, vertical farms)
- Method development for regulatory compliance testing—supporting ISO 8586 sensory evaluation protocols via objective color and texture correlation
FAQ
What spectral resolution does the hyperspectral sensor achieve?
The system employs a push-broom imager with nominal spectral sampling intervals of 2–3 nm across the 400–1000 nm range; effective full-width-at-half-maximum (FWHM) is typically 5–10 nm depending on optical configuration.
Can users develop or import custom chemometric models?
Yes—the software supports import of PLSR, PCR, and SVM models trained in Python (scikit-learn), R, or MATLAB, provided they accept reflectance spectra in ASCII or HDF5 format and output calibrated predictions.
Is the system compatible with existing laboratory information management systems (LIMS)?
Raw data exports (CSV, ENVI, TIFF) and metadata adhere to ISA-Tab conventions; API documentation is available for programmatic integration with LIMS or ELN platforms.
How is measurement repeatability ensured across operators and sessions?
Standardized background plate geometry, fixed illumination geometry, automated white/dark reference capture before each batch, and embedded scale calibration routines collectively maintain inter-session CV <5% for morphological traits and <8% for SSC predictions.
Does the system require external calibration standards?
Factory calibration is performed using NIST-traceable ceramic tiles and certified reflectance standards; annual verification with user-provided reference materials is recommended for long-term stability monitoring.