CEL-QPCE2010 Quantum Efficiency / Incident Photon-to-Current Efficiency (QE/IPCE) Measurement System
| Brand | CEL |
|---|---|
| Origin | Beijing, China |
| Manufacturer Type | Direct Manufacturer |
| Origin Category | Domestic (China-made) |
| Model | CEL-QPCE2010 |
| Price | USD 41,800 (approx.) |
| Trigger Mode | Steady-State |
| Spectral Range | 200–1100 nm |
| Wavelength Step Resolution | ≥1 nm (continuously adjustable) |
| Scan Mode | Fully Automated Spectral Sweep |
| Repeatability | <0.3% (J<sub>sc</sub>) |
| Detection Method | Lock-in Amplifier-Based AC Modulation |
| Chopping Frequency | 5–1000 Hz |
| Temperature-Controlled Stage | 5–40 °C (±0.5 °C) |
| Optional Accessories | Dual Monochromators (300 mm & 150 mm focal length), Bias Light Source (2 channels), Integrating Sphere for Absolute Reflectance/Transmittance |
Overview
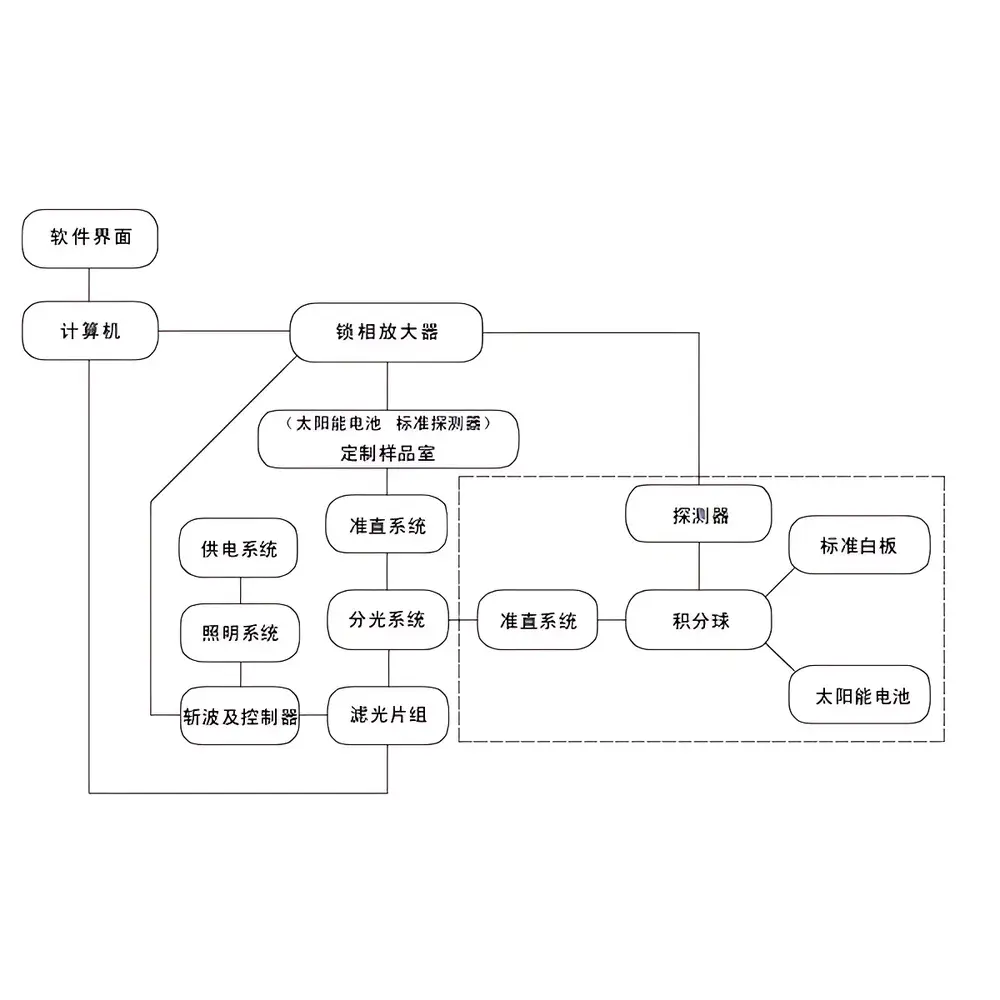
The CEL-QPCE2010 QE/IPCE Measurement System is a precision-engineered, fully automated instrumentation platform designed for quantitative spectral characterization of photovoltaic devices under controlled illumination conditions. Based on the principle of monochromatic photon flux calibration and lock-in detection of photocurrent response, the system determines absolute external quantum efficiency (EQE), internal quantum efficiency (IQE), spectral responsivity (R(λ)), spectral transmittance (T(λ)), and spectral reflectance (Rspec(λ)) across the ultraviolet–visible–near-infrared range (200–1100 nm). It operates in AC modulation mode using a mechanically chopped light source synchronized with a dual-phase lock-in amplifier—enabling high-fidelity extraction of weak photocurrent signals buried beneath electronic and thermal noise. This architecture ensures robust signal-to-noise ratio (S/N > 104 at typical operating points), critical for accurate EQE determination below 10−3 A/W—especially for low-responsivity regions such as UV edges of Si cells or NIR tails of perovskite absorbers.
Key Features
- Fully software-controlled operation with automated wavelength sweep, background subtraction, dark current compensation, and reference calibration routines
- High-stability monochromatic illumination source with selectable 300 mm or 150 mm focal-length monochromators for optimized throughput/resolution trade-off
- Integrated temperature-regulated sample stage (5–40 °C, ±0.5 °C stability) enabling thermal-dependent QE mapping and accelerated aging correlation studies
- Lock-in amplifier-based detection with user-selectable chopping frequency (5–1000 Hz) to optimize S/N for varying device capacitance and recombination kinetics
- Optional dual-channel bias light capability supporting voltage-dependent IQE analysis and quasi-Fermi level splitting estimation
- Compliant optical path design accommodating standard 156 × 156 mm² to 210 × 210 mm² PV cell formats, with provision for mini-module testing via custom sample holders
Sample Compatibility & Compliance
The CEL-QPCE2010 supports standardized spectral evaluation of crystalline silicon photovoltaic devices—including monocrystalline (c-Si) and multicrystalline (mc-Si) solar cells—as well as emerging semiconductor absorbers such as perovskites, CIGS, and organic photovoltaics (OPV). All measurements adhere to internationally recognized test protocols including IEC 60904-8 (Photovoltaic devices — Part 8: Measurement of spectral response of a photovoltaic (PV) device), ASTM E1021 (Standard Test Methods for Spectral Responsivity Measurements of Photovoltaic Devices), and JIS C 8912. The system’s calibrated reference detector traceability follows NIST-traceable standards, and its data acquisition architecture supports audit-ready logging required under GLP and ISO/IEC 17025 laboratory accreditation frameworks.
Software & Data Management
The proprietary QPCE Control Suite provides intuitive GUI-driven workflow management—from instrument initialization and calibration to real-time spectral acquisition and post-processing. Raw data are stored in HDF5 format with embedded metadata (wavelength, bias voltage, temperature, integration time, reference detector reading). Batch processing tools enable normalization to AM1.5G spectral irradiance (IEC 60904-3), calculation of integrated short-circuit current density (Jsc), and generation of IQE from EQE and measured reflectance. Export options include CSV, MATLAB .mat, and PDF reports compliant with internal QA documentation requirements. Audit trail functionality records all parameter changes, user logins, and calibration events—supporting FDA 21 CFR Part 11 compliance when configured with electronic signature modules.
Applications
- Quantitative validation of anti-reflection coating performance across full spectral range
- Front-surface vs. rear-surface recombination analysis via IQE/EQE comparison
- Correlation of spectral response degradation with environmental stress testing (damp heat, thermal cycling)
- Process development feedback for emitter diffusion depth, passivation quality, and contact formation
- Calibration transfer between lab-scale QE systems and production-line IV testers
- Research-grade characterization of tandem cell subcell contributions (e.g., top-cell EQE isolation using selective bias illumination)
FAQ
What is the difference between EQE and IQE, and how does the system derive IQE?
EQE represents the ratio of collected charge carriers per incident photon; IQE excludes optical losses by normalizing to absorbed photons only. The CEL-QPCE2010 calculates IQE by combining measured EQE with independently acquired absolute spectral reflectance (using an integrating sphere) and optionally transmittance—applying the relation: IQE(λ) = EQE(λ) / [1 − R(λ) − T(λ)].
Can the system measure large-area or mini-module samples?
Yes—the optical layout accommodates up to 210 × 210 mm² active area with optional beam homogenization optics. For modules, spatial uniformity mapping requires motorized X-Y stage integration (available as OEM add-on).
Is AM1.5G spectral integration performed in real time or during post-processing?
Jsc integration is computed automatically during data export using the latest IEC 60904-3:2023 reference spectrum, with user-selectable interpolation method (linear vs. cubic spline) and wavelength step weighting.
Does the system support low-light or sub-bandgap measurement capabilities?
With extended integration times and optimized lock-in time constants, the system achieves reliable EQE detection down to ~10−4 A/W—sufficient for characterizing sub-bandgap absorption in passivating contacts or defect-related tail states.
How is calibration traceability maintained?
Primary calibration uses NIST-traceable silicon photodiode standards (Hamamatsu S1337 series) with certified spectral responsivity tables. Annual recalibration services include full optical path verification and uncertainty budget reporting per ISO/IEC 17025 Annex A.