3T analytik qCell μOpto Quartz Crystal Microbalance with Dissipation Monitoring and Integrated Microscopy
| Brand | 3T analytik |
|---|---|
| Origin | Germany |
| Model | qCell μOpto |
| Application | QCM-D with real-time optical microscopy coupling |
| Temperature Control | Peltier-driven |
| Fluid Handling | Integrated peristaltic pump |
| Sample Throughput | Up to 8 independent channels (optional auto-sampler) |
| Compliance | Designed for GLP-compliant workflows, compatible with ISO/IEC 17025 traceability frameworks |
Overview
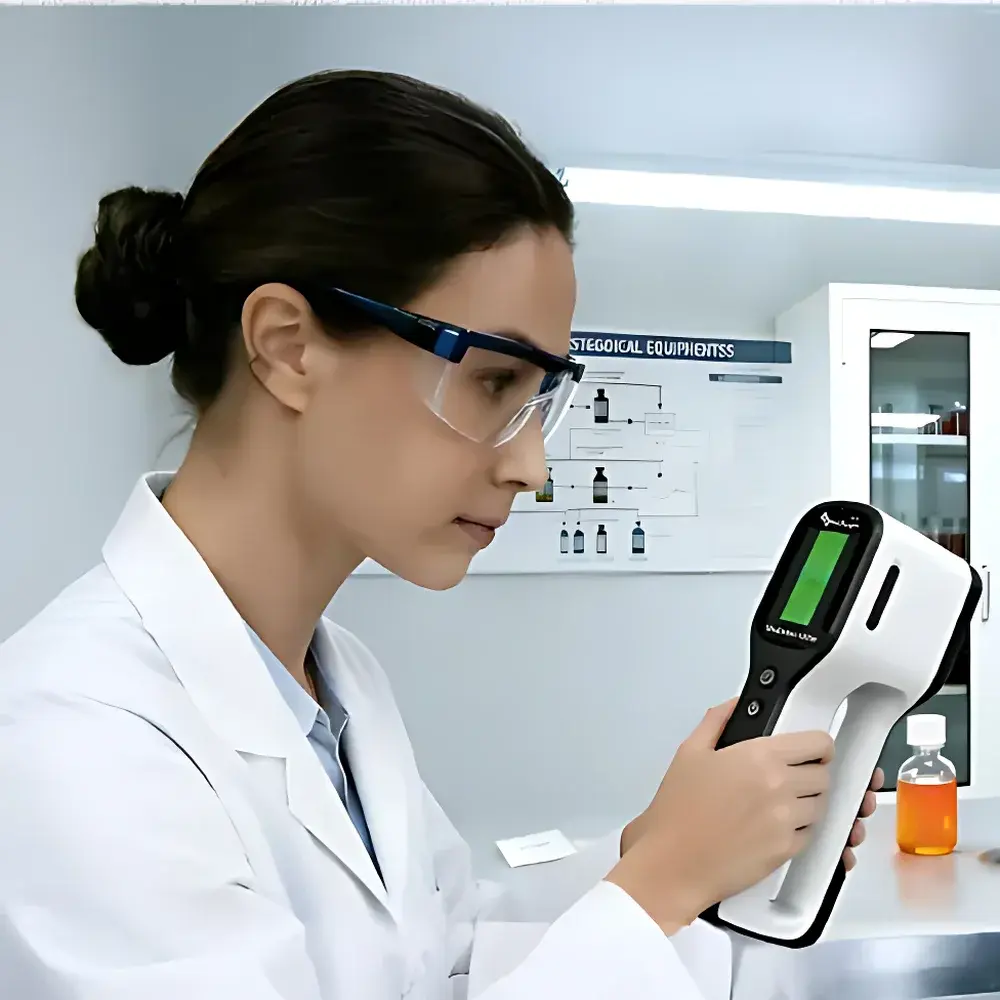
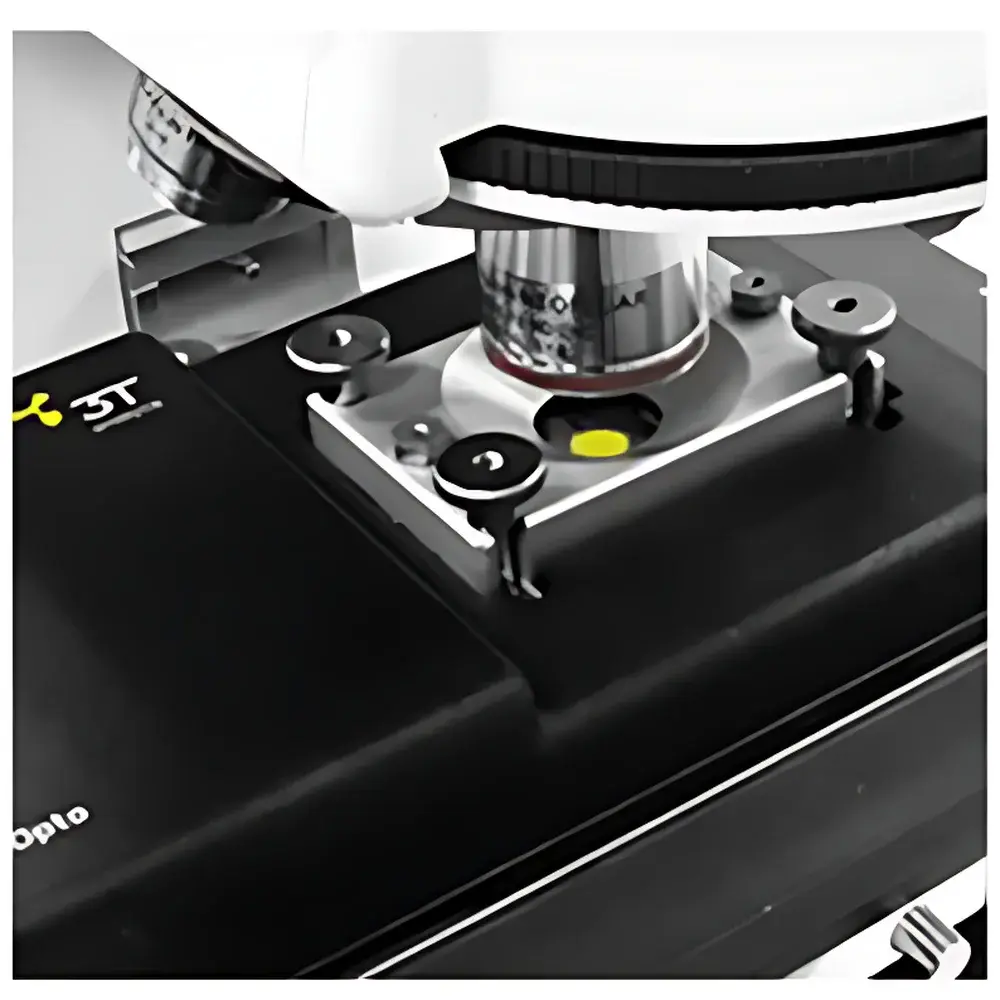
The 3T analytik qCell μOpto is a purpose-engineered quartz crystal microbalance with dissipation monitoring (QCM-D) platform that integrates high-magnification optical microscopy directly into the sensor chamber. Unlike conventional QCM-D systems, the qCell μOpto enables simultaneous, spatially resolved measurement of frequency (Δf) and energy dissipation (ΔD) alongside real-time visualization of surface phenomena at up to 600× magnification. This dual-modality architecture leverages the piezoelectric resonance principle—where a 5 MHz AT-cut quartz crystal oscillates in shear mode—and couples it with label-free optical interrogation of adsorbed layers. The system detects mass changes as small as ~0.1 ng/cm² and quantifies viscoelastic properties via the ΔD/Δf ratio, providing thickness, hydration state, and mechanical rigidity of soft interfacial films. Its core design addresses experimental ambiguity in heterogeneous surface processes—such as patchy protein adsorption or localized biofilm nucleation—by correlating nanogram-level mass uptake with morphological evolution on the sensor surface.
Key Features
- Integrated upright/inverted microscope compatibility: Optimized optical path permits direct observation of the QCM sensor surface without optical distortion or signal attenuation.
- Peltier-based temperature control: Maintains thermal stability within ±0.1 °C across the full operating range (4–45 °C), critical for kinetic studies of temperature-sensitive biomolecular interactions.
- Dual-parameter real-time acquisition: Simultaneous tracking of up to 13 overtones (n = 3–15) for frequency and dissipation, enabling multi-layer modeling using Voigt-based viscoelastic analysis.
- Modular fluidics architecture: Built-in peristaltic pump ensures precise flow rate control (0.01–1.0 mL/min), low-shear delivery, and automated buffer exchange—minimizing bubble formation and baseline drift.
- Flexible configuration options: Operates as a standalone unit or synchronizes with qCell T-series instruments for expanded channel multiplexing and parallelized assay development.
- Patented sensor chip design (US8230724B2): Gold-coated quartz crystals with optimized electrode geometry enhance signal-to-noise ratio and reduce edge effects during high-resolution imaging.
Sample Compatibility & Compliance
The qCell μOpto supports aqueous and organic solvent-based samples, including complex biological media (e.g., cell culture supernatants, serum-containing buffers, and mucin solutions). Sensor surfaces are functionalizable with standard chemistries (thiol-SAMs, silanes, streptavidin-biotin, NHS-ester coupling) and compatible with commercial biosensor chips (e.g., gold, SiO₂, Al₂O₃, and polymer-coated variants). All hardware and software components adhere to CE marking requirements under Directive 2014/30/EU (EMC) and 2014/35/EU (LVD). Data acquisition and storage comply with ALCOA+ principles; qGraph software supports electronic signatures, audit trails, and 21 CFR Part 11–ready user access controls when deployed in regulated environments (e.g., pharmaceutical QC labs conducting USP analytical instrument qualification).
Software & Data Management
qGraph v5.x provides a unified interface for instrument control, experiment scheduling, and advanced data reduction. It includes built-in modules for Sauerbrey mass conversion, Voigt-layer modeling, and time-resolved correlation of optical events (e.g., particle arrival, cluster formation) with QCM-D transients. Raw data are stored in HDF5 format with embedded metadata (timestamp, temperature, flow rate, sensor ID), ensuring FAIR (Findable, Accessible, Interoperable, Reusable) compliance. Export options include CSV, MATLAB (.mat), and Origin-compatible formats. Batch processing scripts enable reproducible analysis across multi-day experiments—essential for long-term stability testing or comparative screening studies.
Applications
- Colloidal adhesion kinetics: Quantifying binding affinity and detachment forces of nanoparticles under laminar flow, correlated with real-time aggregation morphology.
- Bacterial adhesion and early biofilm development: Resolving strain-specific differences in initial attachment density, extracellular polymeric substance (EPS) secretion onset, and viscoelastic stiffening.
- Cell-substrate interaction dynamics: Monitoring integrin-mediated spreading, focal adhesion maturation, and cytoskeletal remodeling through coupled Δf/ΔD trends and phase-contrast imaging.
- Protein corona formation on nanocarriers: Mapping time-dependent conformational changes and competitive adsorption in multi-protein environments.
- Electroactive polymer swelling/deswelling: Characterizing ion-driven volume transitions in conductive hydrogels under potentiostatic control (when interfaced with external electrochemical workstations).
FAQ
Can the qCell μOpto be used with non-standard sensor coatings (e.g., ITO, graphene oxide)?
Yes—the system accepts custom-fabricated sensor chips with standardized 14 mm diameter and 0.5 mm thickness, provided electrical contact integrity and acoustic impedance matching are maintained.
Is temperature calibration traceable to national standards?
Each unit ships with a factory calibration certificate referencing PTB (Physikalisch-Technische Bundesanstalt) traceable thermistors; optional on-site recalibration services are available.
Does qGraph support third-party image analysis tools (e.g., ImageJ, Python OpenCV)?
Yes—time-stamped microscope video streams are exported as synchronized TIFF stacks with embedded QCM-D metadata, enabling cross-platform algorithmic processing.
What maintenance intervals are recommended for the peristaltic pump tubing?
Tubing replacement is advised every 6 months under continuous operation; wear indicators are integrated into qGraph’s preventive maintenance scheduler.
How is data integrity ensured during extended unattended runs (e.g., 72-hour biofilm assays)?
The system performs automatic checksum validation of all acquired datasets and logs hardware status (voltage, temperature, pressure) at 10-second intervals—enabling root-cause analysis of any transient anomalies.
Related Products