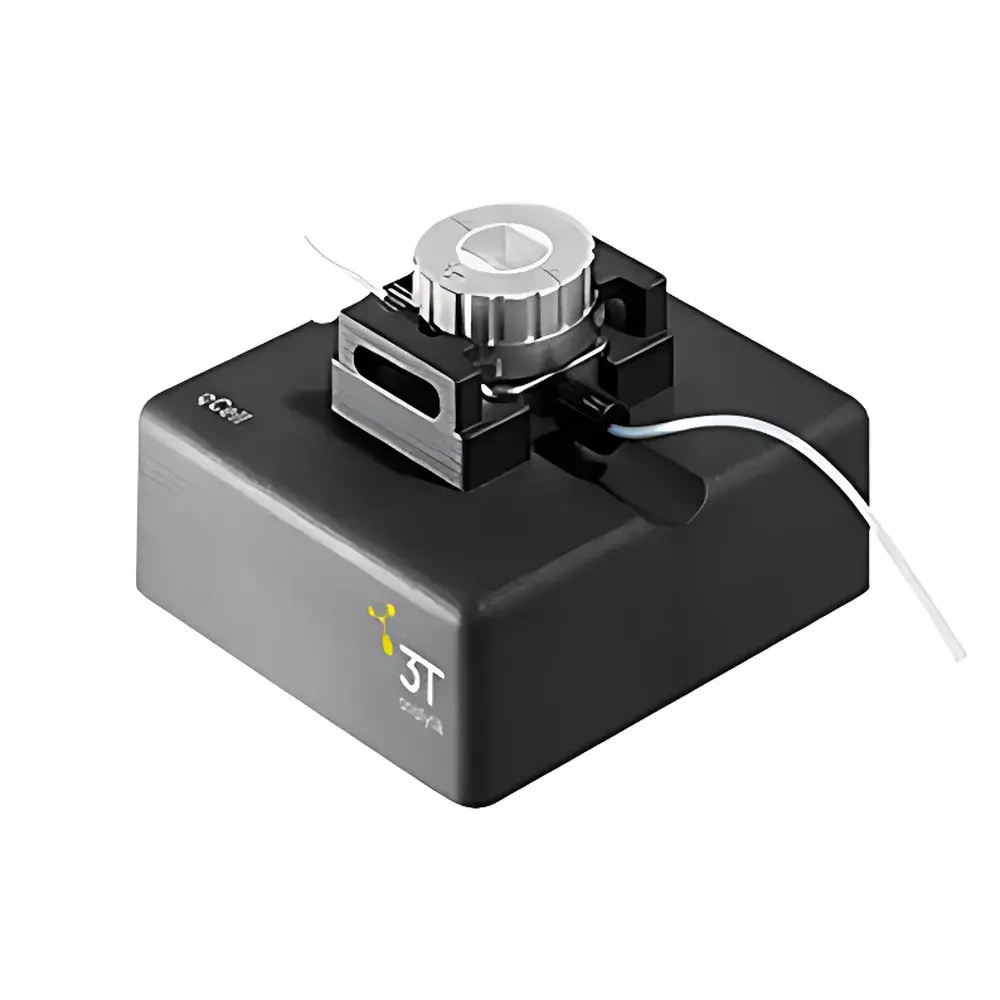
3T analytik qCell Quartz Crystal Microbalance (QCM-D) Sensor Platform
| Brand | 3T analytik |
|---|---|
| Origin | Germany |
| Model | qCell |
| Configuration | Single-channel (dual- and 4-channel optional) |
| Temperature Control | None (Peltier module not integrated |
| Fluid Handling | Manual or optional peristaltic pump |
| Detection Mode | Simultaneous frequency (Δf) and dissipation (ΔD) monitoring |
| Software | qGraph v5.x |
| Compliance | CE-marked, ISO 9001–certified manufacturing |
| Pricing Range | USD 28,000 – 72,000 (FOB Hamburg) |
Overview
The 3T analytik qCell is a compact, entry-level quartz crystal microbalance with dissipation monitoring (QCM-D) sensor platform engineered for real-time, label-free analysis of interfacial phenomena at solid–liquid and solid–gas interfaces. Based on the piezoelectric resonance principle, the qCell measures nanogram-level mass changes—down to sub-monolayer coverage—by tracking shifts in the fundamental resonant frequency (Δf, in Hz) of an AT-cut quartz crystal sensor (typically 5 MHz). Crucially, it simultaneously quantifies energy dissipation (ΔD, dimensionless, ×10⁻⁶), enabling differentiation between rigidly bound and viscoelastic adsorbed layers. This dual-parameter output allows quantitative inference of adsorbed mass, hydrated thickness, shear modulus, and structural rigidity—without optical labels or radioactive tracers. Designed and assembled in Tuttlingen, Germany, the qCell reflects 3T analytik’s core expertise in surface-sensitive instrumentation and adheres to stringent European quality standards throughout its mechanical architecture, electronic signal conditioning, and sensor interface design.
Key Features
- Single-channel base configuration with field-upgradable options for dual- and 4-channel parallel measurements
- Simultaneous, synchronized acquisition of frequency shift (Δf) and dissipation factor (ΔD) at fundamental resonance (5 MHz) and up to five overtones (3rd, 5th, 7th, 9th, 11th)
- Modular fluidics interface supporting manual syringe injection or optional integrated peristaltic pump for automated flow control and buffer exchange
- Patented quartz sensor holder (US8230724B2) ensuring reproducible mounting pressure, minimal acoustic coupling loss, and long-term resonance stability
- Low-noise analog front-end electronics with 0.1 Hz frequency resolution and <0.5 × 10⁻⁶ D resolution under controlled lab conditions
- Compact benchtop footprint (240 × 300 × 180 mm) with USB 2.0 connectivity and passive thermal mass design for ambient-stable operation
Sample Compatibility & Compliance
The qCell accommodates standard 14 mm diameter QCM-D sensor chips with gold-coated electrodes (e.g., QSX-301, QSX-303) and supports custom chip substrates including SiO₂, Al₂O₃, and functionalized polymer surfaces. It operates reliably across aqueous buffers (PBS, HEPES, Tris), organic solvents (ethanol, chloroform), and low-conductivity media (e.g., cell culture supernatants, nanoparticle dispersions). All hardware and firmware comply with EU Directive 2014/30/EU (EMC) and 2014/35/EU (LVD); CE marking is affixed. Manufacturing follows ISO 9001:2015 protocols. While the qCell itself does not embed FDA 21 CFR Part 11 audit trails, qGraph software supports user-defined electronic signatures and exportable raw data files (CSV, TXT) compatible with GLP/GMP-aligned laboratory information management systems (LIMS).
Software & Data Management
qGraph v5.x provides intuitive, script-free experimental control and real-time visualization of Δf and ΔD kinetics across selected overtones. The software enables baseline subtraction, drift correction, and Sauerbrey or Voigt-based modeling for quantitative mass/thickness estimation. Export formats include time-stamped CSV for post-processing in MATLAB, Python (NumPy/Pandas), or OriginLab. Batch processing tools allow comparative analysis across multiple sensor channels or experimental replicates. All raw data—including timestamped analog-to-digital converter (ADC) values—are stored locally with metadata (sensor ID, date/time, user tag, fluid history). No cloud upload or telemetry is performed by default; data sovereignty remains fully under user control.
Applications
- Real-time monitoring of protein adsorption, antibody–antigen binding, and DNA hybridization kinetics
- Quantitative assessment of live cell adhesion, spreading, and detachment under pharmacological stimulation
- Characterization of polyelectrolyte multilayer (PEM) growth, crosslinking density, and solvent-induced swelling
- In situ analysis of enzymatic degradation of hydrogels or extracellular matrix mimics
- Evaluation of blood plasma coagulation dynamics on biomaterial surfaces
- Stability screening of colloidal nanoparticles in complex media (e.g., serum, wastewater effluent)
- Viscoelastic profiling of bacterial biofilm formation and antibiotic-induced structural collapse
- Adsorption thermodynamics of surfactants, micelles, and lipid vesicles at functionalized interfaces
FAQ
Does the qCell support temperature-controlled experiments?
No—the qCell platform lacks an integrated Peltier element. For precise thermal regulation (±0.1 °C), users should consider the qCell T-series or upgrade to the qCell-T module as a retrofit option.
Can I use third-party QCM sensors with the qCell?
Yes, provided they conform to standard 14 mm diameter, 5 MHz AT-cut geometry and gold electrode specifications. Full dissipation calibration requires factory-matched sensor characterization data.
Is qGraph compliant with 21 CFR Part 11 for regulated environments?
qGraph does not natively implement electronic signatures or audit trail logging. However, its deterministic data export and timestamp integrity enable integration into validated workflows when paired with external LIMS or ELN systems.
What is the minimum detectable mass change?
Under optimal conditions (clean fluid, stable temperature, low noise), the system resolves frequency shifts ≥0.1 Hz—corresponding to ~0.1 ng/cm² mass change on a 5 MHz sensor using the Sauerbrey equation.
How often does the quartz sensor require recalibration?
No routine recalibration is needed. Sensor sensitivity is determined once during manufacturing and stored in chip-specific EEPROM. Users perform daily baseline verification using air and buffer reference measurements.