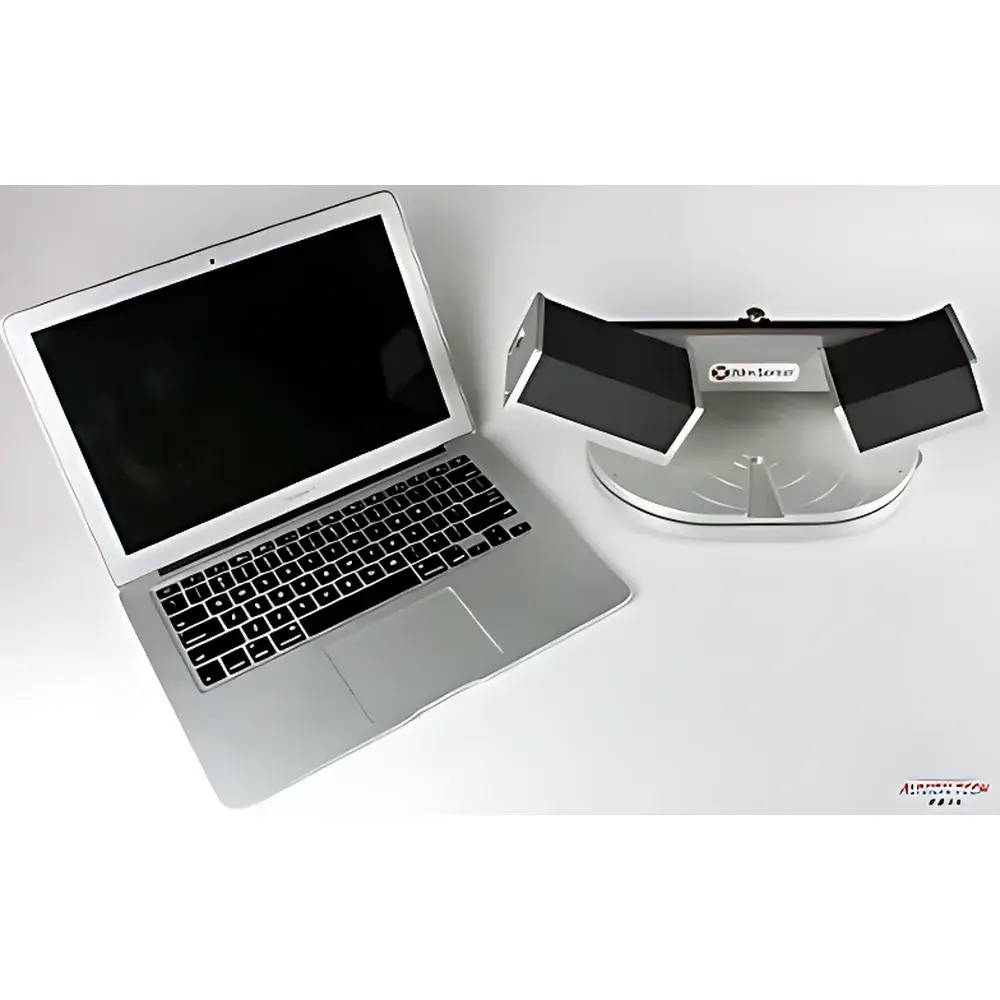
Auniontech AUTFS1 Multi-Wavelength Ellipsometer
| Brand | Auniontech |
|---|---|
| Model | AUTFS1 |
| Measurement Principle | Null-Null Ellipsometry (LED-based, Fixed-Optic Configuration) |
| Wavelengths | 465 nm, 525 nm, 580 nm, 635 nm (High-Stability LEDs) |
| Spot Size Options | 0.8 × 1.9 mm or 0.3 × 0.7 mm (with optional focusing optics) |
| Measurement Speed | ≤1 s per acquisition |
| Thickness Range (Transparent Films) | 0–1000 nm (sub-Å resolution for ultra-thin layers) |
| Optical Parameters Output | n(λ), k(λ), film thickness (d), surface roughness (optional modeling), multilayer stack parameters |
| Detector Type | Solid-state, no moving parts, phase-resolved PSD |
| Compliance | Designed for GLP-compliant thin-film metrology workflows |
| Software | Windows-based analysis suite with regression modeling, multi-wavelength global fitting, and export to CSV, XML, and HDF5 formats |
Overview
The Auniontech AUTFS1 Multi-Wavelength Ellipsometer is a compact, solid-state optical metrology instrument engineered for high-precision, non-contact characterization of thin films and surfaces using null-null ellipsometry. It operates on the fundamental principle that the change in polarization state—quantified by the complex ratio ρ = rp/rs = tan(Ψ)eiΔ—between p- and s-polarized light upon reflection encodes intrinsic optical constants (n, k) and geometric parameters (thickness, interface roughness) of layered structures. Unlike intensity-dependent techniques, ellipsometry measures ratios, rendering it inherently insensitive to source intensity drift, detector gain variation, and non-specular scattering from particulates or surface defects. The AUTFS1 leverages four discrete, thermally stabilized LED sources (465 nm, 525 nm, 580 nm, 635 nm) to enable simultaneous multi-wavelength acquisition without mechanical wavelength scanning—eliminating spectral calibration drift and motion-induced misalignment. Its fixed-optic architecture integrates a photoelastic modulator-free polarization state generator (PSG) and a solid-state polarization state detector (PSD), ensuring long-term stability and reproducibility under laboratory or integrated process environments.
Key Features
- Solid-state optical path: No moving parts in polarization generation or detection—enabling >10,000 hours of LED lifetime and zero mechanical wear.
- Sub-Å thickness resolution: Achieved via high signal-to-noise ratio (SNR) at each wavelength and robust global fitting across the multi-wavelength dataset.
- Real-time in-situ compatibility: Compact footprint (220 × 180 × 140 mm) and vacuum-compatible mounting flanges support direct integration into ALD (e.g., Kurt Lesker) and sputtering (e.g., AJA) chambers.
- Configurable spot size: Standard 1.5 mm circular beam; optional focusing optics yield elliptical spots of 0.8 × 1.9 mm or 0.3 × 0.7 mm for micro-area analysis or patterned substrate mapping.
- Single-shot acquisition: Full Ψ(λ) and Δ(λ) spectra acquired in ≤1 second—enabling kinetic monitoring of growth, etching, or annealing processes.
Sample Compatibility & Compliance
The AUTFS1 supports dielectric, semiconductor, and metallic thin films—including SiO2, SiNx, ITO, Al2O3, and organic layers—on rigid substrates (Si, glass, sapphire) and flexible foils. It is validated for single-layer, bilayer, and graded-index models, with built-in support for Cauchy, Sellmeier, Tauc-Lorentz, and B-spline dispersion models. All measurement data include full audit trails (timestamp, instrument ID, operator tag, environmental metadata), satisfying GLP documentation requirements. While not FDA 21 CFR Part 11 certified out-of-the-box, the software architecture supports integration with third-party electronic lab notebook (ELN) systems compliant with ISO/IEC 17025 and ASTM E2500-17 for validation-ready deployment.
Software & Data Management
The included WinEllip software provides a modular, scriptable environment for model definition, multi-wavelength regression, uncertainty quantification (via covariance matrix analysis), and batch processing. Raw data are stored in HDF5 format—ensuring interoperability with Python (h5py), MATLAB, and OriginLab. Export options include CSV (for spreadsheet-based QA/QC), XML (for LIMS ingestion), and industry-standard JADE-compatible files. Advanced users may extend functionality via Python API bindings for automated model selection, machine-learning-assisted parameter initialization, or closed-loop feedback to deposition controllers.
Applications
- In-situ atomic layer deposition (ALD) monitoring: Real-time tracking of nucleation delay, growth per cycle (GPC), and interfacial oxidation.
- Sputter-deposited transparent conductive oxide (TCO) optimization: Correlating n/k dispersion with carrier concentration and mobility.
- Photoresist and anti-reflective coating (ARC) development: Quantifying thickness uniformity and solvent-induced swelling during bake steps.
- Multilayer solar cell stack metrology: Resolving individual layer thicknesses in CIGS or perovskite architectures where XRD or TEM are impractical.
- Surface functionalization kinetics: Measuring sub-nanometer adsorption layers on biosensor chips or catalytic surfaces.
FAQ
What is the minimum measurable film thickness?
The system achieves effective resolution down to 0.001 nm for ultra-thin native oxides or self-assembled monolayers (SAMs), contingent on optical contrast and model uniqueness.
Can the AUTFS1 measure absorbing or opaque films?
Yes—within limits. It quantifies complex refractive index (n + ik) for weakly absorbing layers (k < 0.5) up to ~200 nm; for highly opaque metals, it reports effective thickness and surface roughness within physically constrained models.
Is vacuum operation supported?
Standard configuration includes CF-35 or KF-25 flange options; optional quartz viewport integration enables operation at pressures ≤10−6 mbar.
How is calibration performed?
Factory calibration uses NIST-traceable Si/SiO2 reference wafers; user-level verification employs air and bare-Si measurements—no routine recalibration required under stable thermal conditions.
Does the software support custom dispersion models?
Yes—users may define analytical or tabulated (n,k)-vs-λ functions via DLL plug-ins or Python callbacks, enabling proprietary material libraries and physics-informed fitting constraints.
Related Products