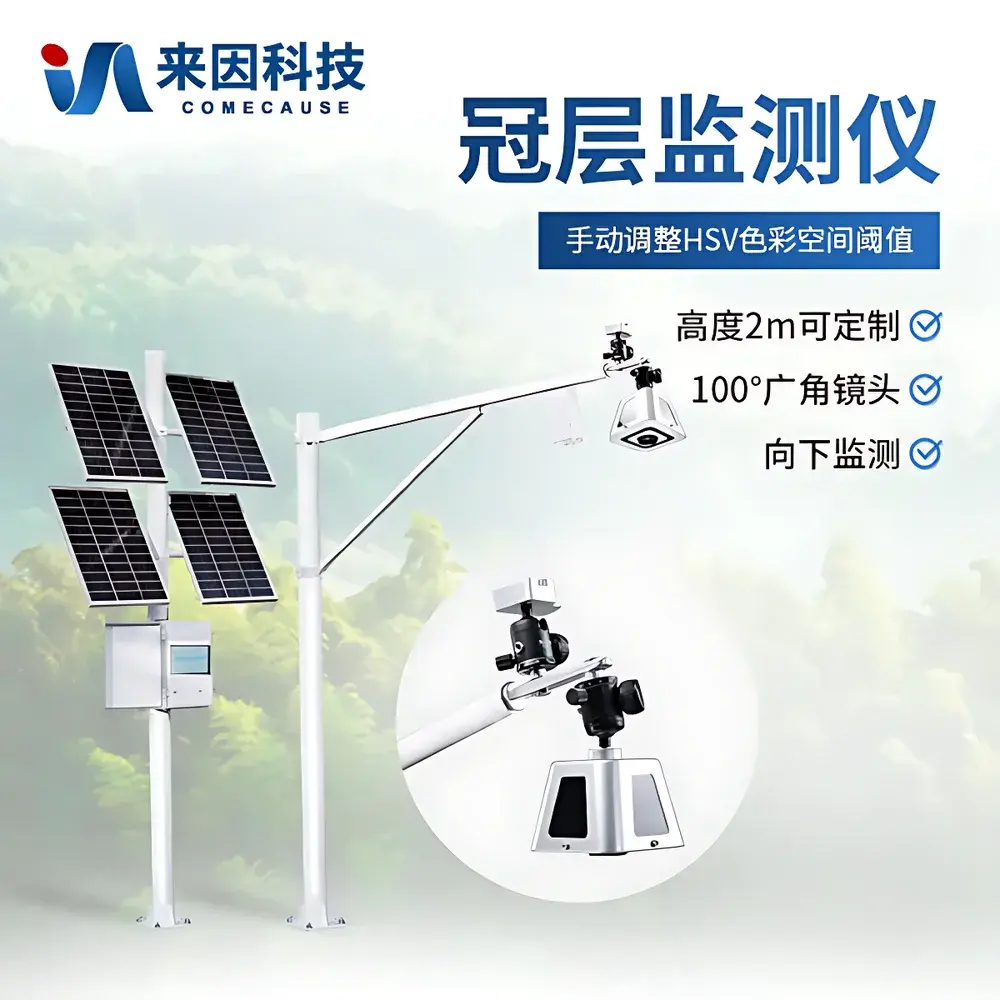
COMECAUSE IN-G200 Canopy Analyzer for Real-Time Plant Canopy Monitoring
| Brand | COMECAUSE |
|---|---|
| Origin | Shandong, China |
| Manufacturer Type | Direct Manufacturer |
| Country of Origin | China |
| Model | IN-G200 |
| Price | USD 8,100 (FOB) |
Overview
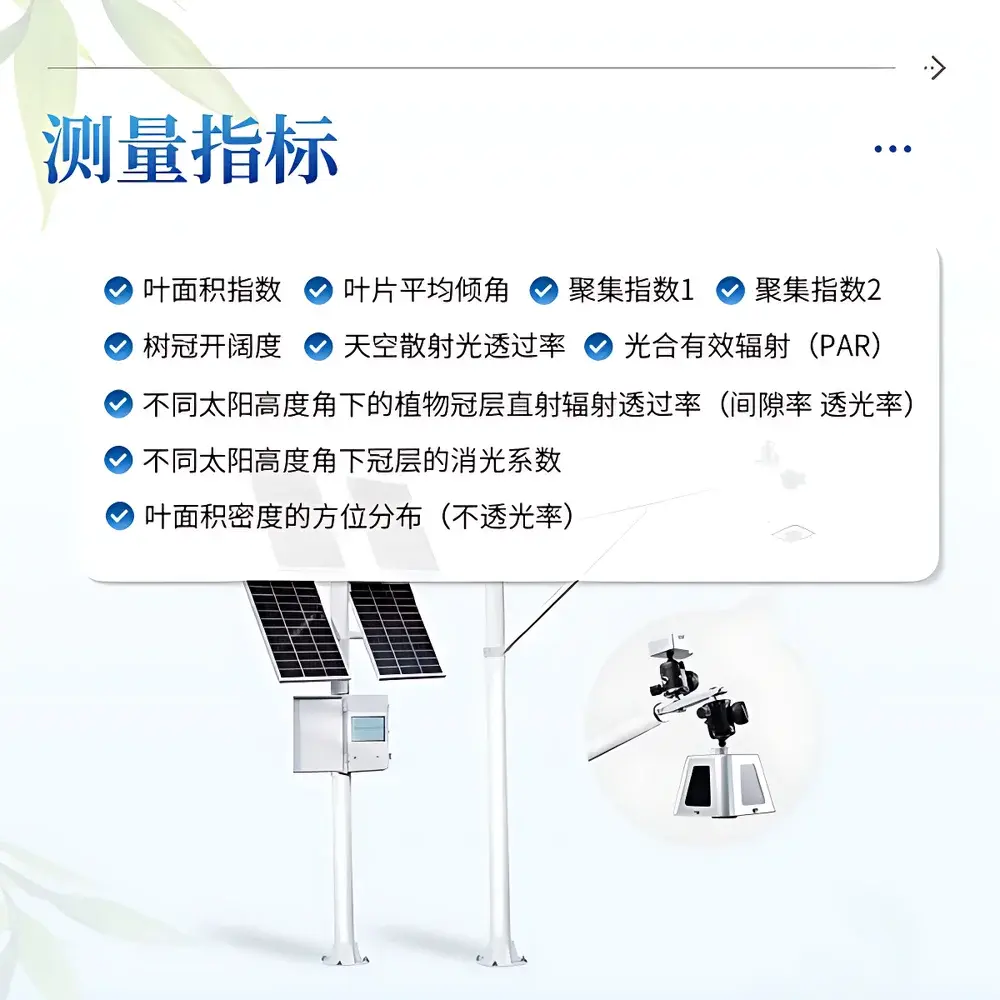
The COMECAUSE IN-G200 Canopy Analyzer is a field-deployable, solar-powered instrument engineered for continuous, non-destructive monitoring of structural and radiative properties of plant canopies. It operates on the widely accepted principle of hemispherical photography—capturing downward-looking fisheye images from above the canopy to quantify light interception geometry and spatial arrangement of foliage. By analyzing pixel-level brightness distribution within calibrated hemispherical images, the system computes biophysically meaningful canopy descriptors including leaf area index (LAI), gap fraction, clumping index, extinction coefficient, and azimuthal leaf area density distribution. Designed for long-term unattended operation in agro-ecological environments, the IN-G200 supports precision agriculture workflows, ecological monitoring programs, and climate-resilient crop management research under real-world field conditions.
Key Features
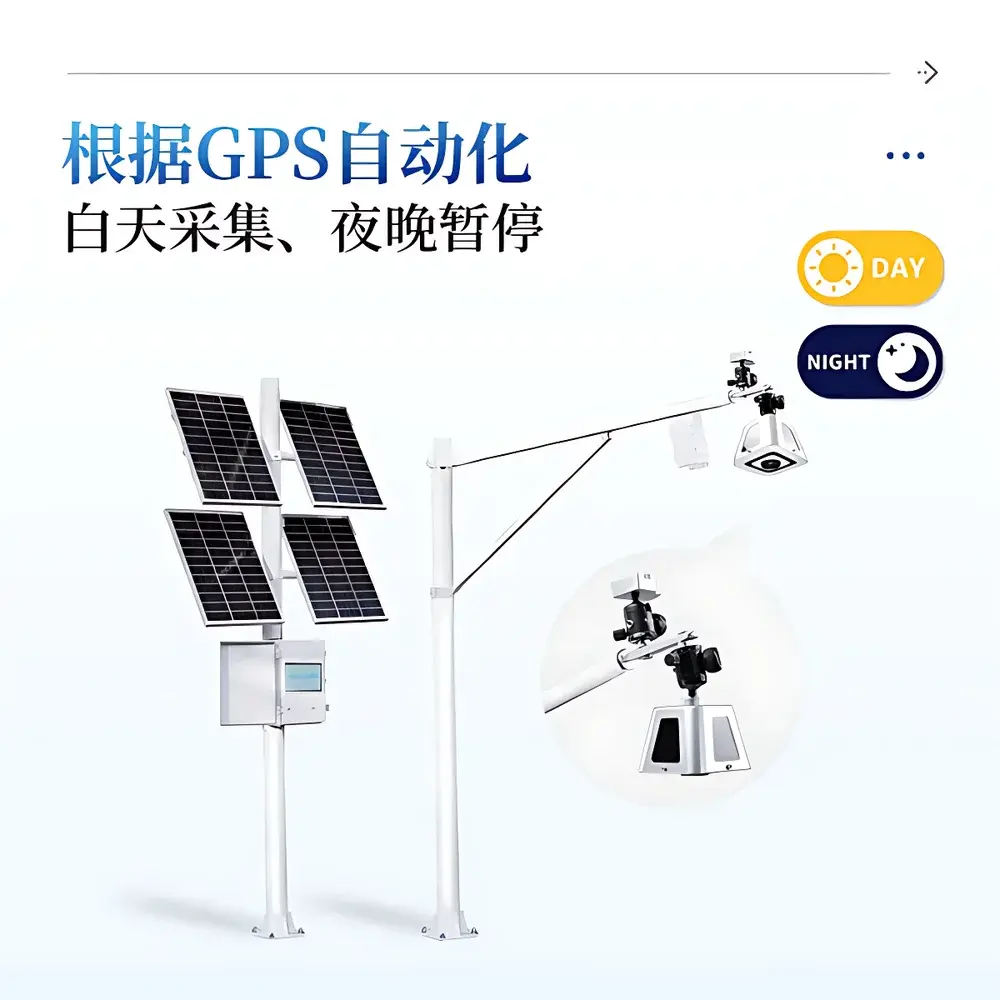
- Solar-reliant autonomous operation: Integrated 200 W monocrystalline photovoltaic panel and 130 Ah sealed gel battery ensure >6 months of continuous deployment without grid power—field-tested across temperate and semi-arid zones (-10 °C to +55 °C operating range).
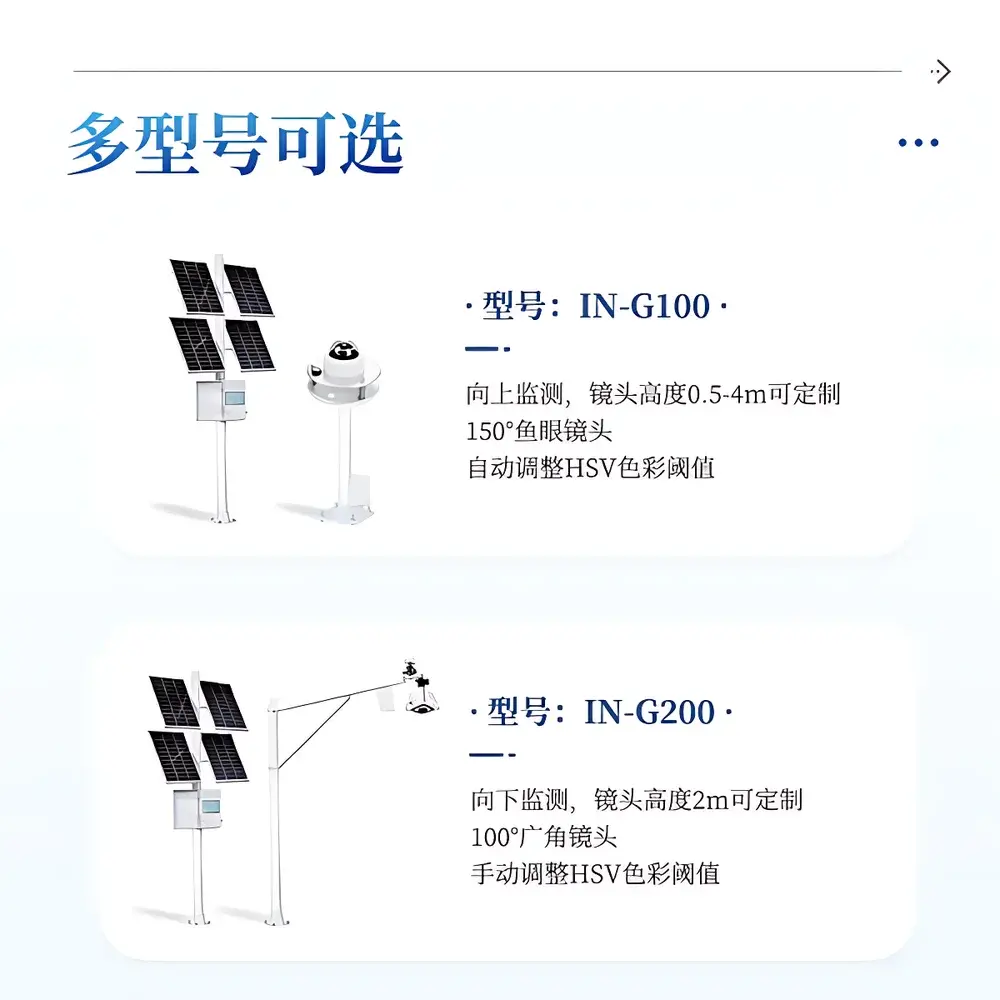
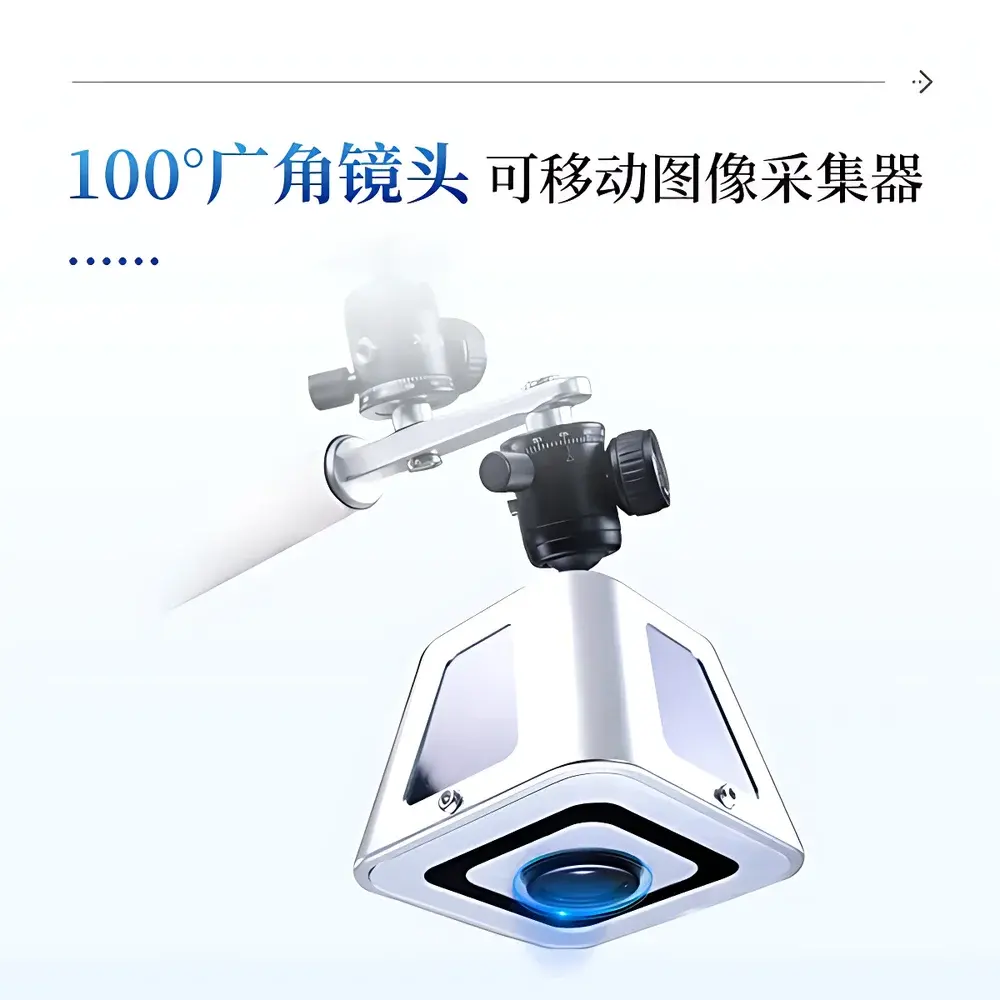
- Hemispherical imaging architecture: Motorized pan-tilt image capture unit equipped with a 100° ultra-wide-angle lens (equivalent to 180° full-hemisphere coverage when corrected), enabling systematic partitioning of the sky vault into 10 zenith angle bands (0°–75°) and 10 azimuth sectors (0°–360°).
- Dual-sensor radiometric capability: Co-located PAR sensor (400–700 nm spectral response) with ±5% calibration traceability, measuring incident photosynthetically active radiation from 0 to 2000 µmol·m⁻²·s⁻¹—synchronized with each image acquisition.
- Onboard image processing engine: Embedded Linux-based analysis module performs real-time HSV color space thresholding (user-adjustable), gap fraction mapping, and LAI derivation using the Beer-Lambert–based inversion algorithm per ISO 11727:2022 Annex C.
- Intuitive 10-inch capacitive touchscreen interface: Supports multilingual UI (English/Chinese), historical data visualization, manual trigger mode, and configuration of acquisition intervals (1–72 hours), GPS-triggered diurnal scheduling, and transmission protocols.
Sample Compatibility & Compliance
The IN-G200 is compatible with herbaceous and woody vegetation types—including row crops (maize, soybean), orchards (apple, citrus), forest understory, and perennial grasslands—provided the sensor is mounted at ≥2 m height above canopy closure. Its optical methodology conforms to internationally recognized protocols for indirect LAI estimation, aligning with FAO’s CropWat guidelines and ASTM E2913-22 for digital canopy assessment. Data integrity meets GLP-aligned requirements through timestamped metadata embedding (GPS coordinates, UTC time, battery voltage, sensor temperature), and all raw images and processed metrics are stored with SHA-256 checksums for audit readiness.
Software & Data Management
Data acquisition, preprocessing, and export are managed via the COMECAUSE AgriCloud Platform—a secure, role-based web portal compliant with GDPR and ISO/IEC 27001 information security standards. Each device generates encrypted JSON-formatted records containing LAI, gap fraction, clumping index (Ω₁, Ω₂), direct beam transmittance at 10 solar elevation angles, diffuse transmittance, and PAR-integrated daily totals. Users may download time-series CSV files, generate PDF reports with embedded scatter plots (e.g., LAI vs. NDVI), or integrate API endpoints into third-party farm management systems (e.g., Climate FieldView™, Granular). Local storage retains ≥180 days of high-resolution TIFF images (2592 × 1944 px) and metadata on the onboard 20 GB eMMC—accessible via USB-C for offline validation or reprocessing.
Applications
- Dynamic canopy development tracking across phenological stages—from emergence to senescence—in breeding trials and variety evaluation programs.
- Quantifying canopy light interception efficiency to calibrate crop growth models (e.g., APSIM, DSSAT) and optimize nitrogen application timing.
- Assessing intercropping architecture and vertical light stratification in agroforestry systems.
- Validating satellite-derived LAI products (e.g., Sentinel-2 MAJA, MODIS MCD15A3H) at field scale for regional upscaling.
- Monitoring canopy closure rates in no-till or cover crop systems to inform weed suppression thresholds.
FAQ
What is the recommended mounting height for optimal accuracy?
For most agricultural canopies ≤2 m tall, a fixed height of 2 m above the highest foliage is standard; custom brackets support heights up to 5 m for orchard or forest applications.
Does the system require manual calibration in the field?
No—factory-calibrated PAR sensor and pre-validated HSV segmentation thresholds eliminate routine recalibration; users may adjust hue/saturation/value bounds for site-specific canopy reflectance characteristics.
Can data be exported in formats compatible with R or Python analysis pipelines?
Yes—CSV exports include ISO 8601 timestamps, SI units, and column headers conforming to CF Metadata Conventions v1.8 for seamless ingestion into Pandas, tidyverse, or netCDF workflows.
Is the cloud platform accessible via mobile devices?
Yes—the AgriCloud Portal is fully responsive and supports iOS and Android browsers, enabling real-time alerts and remote parameter updates without native app installation.
How is data security ensured during 4G transmission?
All telemetry uses TLS 1.3 encryption; device authentication employs X.509 certificates, and cloud storage adheres to AES-256 encryption at rest per NIST SP 800-53 Rev. 5 controls.