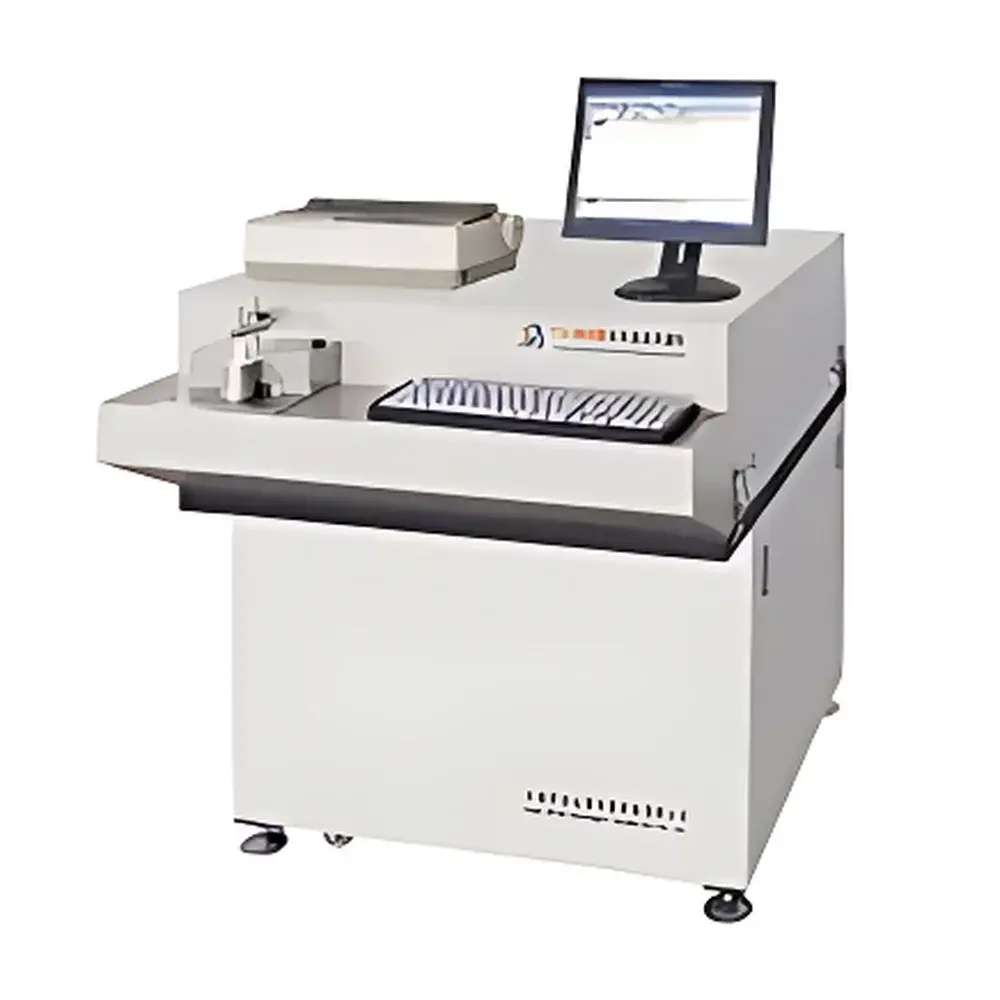
MC049-TY-9600 Spark Optical Emission Spectrometer (OES)
| [Origin | Shanghai, China |
|---|---|
| Manufacturer Type | Authorized Distributor |
| Domestic Product Classification | Domestic |
| Detector Type | Charge-Coupled Device (CCD) |
| Channel Capacity | Up to 64 optical channels |
| Wavelength Range | 160–650 nm |
| Excitation Frequency | 200–600 Hz |
| Analytical Reproducibility | RSD ≤ 0.2% |
| Grating Radius | 1000 mm |
| Groove Density | 1667 lines/mm |
| Entrance Angle | 35° |
| Sample Gap | 4 mm |
| PMT Voltage Range | –550 V to –1000 V (8-step digital adjustment) |
| Thermal Stability | 35 °C ± 0.5 °C (localized spectrometer chamber)] |
Overview
The MC049-TY-9600 Spark Optical Emission Spectrometer (OES) is a high-performance, laboratory-grade direct-reading spectrometer engineered for rapid, precise quantitative elemental analysis of metallic alloys. Based on the principle of spark-induced atomic emission spectroscopy, the instrument vaporizes and excites surface material from solid metal samples using a controlled pulsed spark discharge; emitted radiation is dispersed via a high-resolution concave grating and detected across multiple wavelength intervals using a thermally stabilized CCD array. Designed for routine quality control in foundries, metallurgical plants, and third-party testing laboratories, the TY-9600 delivers simultaneous multi-element detection with sub-second spectral acquisition and robust long-term signal stability—enabling compliance with ASTM E415, ISO 11577, and GB/T 4336 standards for ferrous and non-ferrous alloy verification.
Key Features
- Modular optical bench with localized thermostatic control (35 °C ± 0.5 °C), minimizing thermal drift and ensuring baseline stability during extended operation.
- Programmable spark source with adjustable frequency (200–600 Hz), variable pre-burn and integration timing, and auto-regulated peak voltage (300 V DC) for optimized excitation across diverse matrices—including Al-, Cu-, Mg-, Zn-, Fe-, and Ni-based alloys.
- High-efficiency Czerny–Turner optical path incorporating a 1000 mm radius, 1667 grooves/mm holographically ruled concave grating, delivering resolving power sufficient for critical line separation (e.g., Fe I 238.204 nm / Cr I 238.203 nm).
- Digital high-voltage supply for photodetector biasing, offering eight discrete negative voltage steps (–550 V to –1000 V) per channel—enabling dynamic optimization of signal-to-noise ratio and linear dynamic range without hardware reconfiguration.
- Integrated single-board controller with real-time data buffering and bidirectional RS-485/USB communication to host PC, supporting deterministic latency for synchronized spark triggering and spectral readout.
- Automated wavelength calibration (auto-peak search and trace alignment) executed via software interface—requiring no manual slit adjustment or optical expertise.
Sample Compatibility & Compliance
The TY-9600 supports flat, polished solid metal samples (diameter ≥ 10 mm, thickness ≥ 4 mm) across six primary base materials: carbon steel, stainless steel, aluminum, copper, magnesium, and titanium alloys—with over 100 pre-calibrated grade libraries available. Sample introduction conforms to ISO 14284 for sampling of cast metals and ASTM E1086 for stainless steel analysis. The system architecture complies with GLP documentation requirements: audit trails for calibration events, user access logs, and version-controlled method files are retained locally and exportable in CSV/XML. While not FDA 21 CFR Part 11–certified out-of-the-box, the software platform supports electronic signature configuration and secure user role assignment (Admin, Analyst, Reviewer) to facilitate GMP-aligned validation protocols.
Software & Data Management
Operation is managed through a native Windows-based application with bilingual UI support (English/Chinese), featuring intuitive workflow navigation, real-time spectrum visualization, and statistical process control (SPC) charting. Calibration models are stored as encrypted binary templates with embedded uncertainty metadata. All analytical results—including raw intensity counts, normalized net intensities, certified reference material (CRM) match scores, and RSD calculations—are timestamped and written to a local SQLite database. Remote data export is enabled via TCP/IP socket interface or scheduled FTP/SFTP push, compatible with LIMS platforms such as Thermo Fisher SampleManager and LabVantage. Software updates are delivered via signed firmware packages with SHA-256 hash verification.
Applications
- Real-time melt shop monitoring: rapid grade identification and residual element verification prior to casting.
- Finished product certification per ASTM A751, EN 10204 3.1, or customer-specific material test reports (MTRs).
- Scrap sorting and recycling QA/QC, particularly for mixed aluminum or copper feedstock streams.
- R&D alloy development requiring high-precision trace element quantification (e.g., B, Sn, Pb, As at sub-10 ppm levels).
- Failure analysis labs performing comparative compositional mapping of fracture surfaces or heat-affected zones.
FAQ
What sample preparation is required prior to analysis?
Flat, clean, and oxide-free surfaces must be prepared by lathe turning or grinding using SiC abrasive paper (P180–P400). Surface roughness should not exceed Ra 0.8 µm. Samples must be electrically conductive and free of oil, grease, or coating residues.
Can the instrument analyze coated or plated metals?
No—coatings interfere with spark plasma formation and cause spectral interferences. Samples must be analyzed on bulk substrate material. Cross-sectioning and polishing may be used to expose underlying layers for depth-resolved assessment.
Is argon purge mandatory for operation?
Yes. Continuous high-purity argon (≥99.996%) purge is required to suppress atmospheric nitrogen and oxygen absorption bands below 200 nm, especially for accurate determination of C, P, S, and N.
How frequently does the optical system require recalibration?
Full wavelength calibration is recommended after every 500–1000 sparks or following ambient temperature shifts exceeding ±3 °C. Intensity normalization using internal standard lines (e.g., Fe II 238.204 nm) is performed automatically before each analysis sequence.
Does the system support custom method development?
Yes. Users may define new calibration curves using certified reference materials (CRMs), assign custom interference corrections, and configure reporting templates compliant with internal QA documentation standards.
Related Products