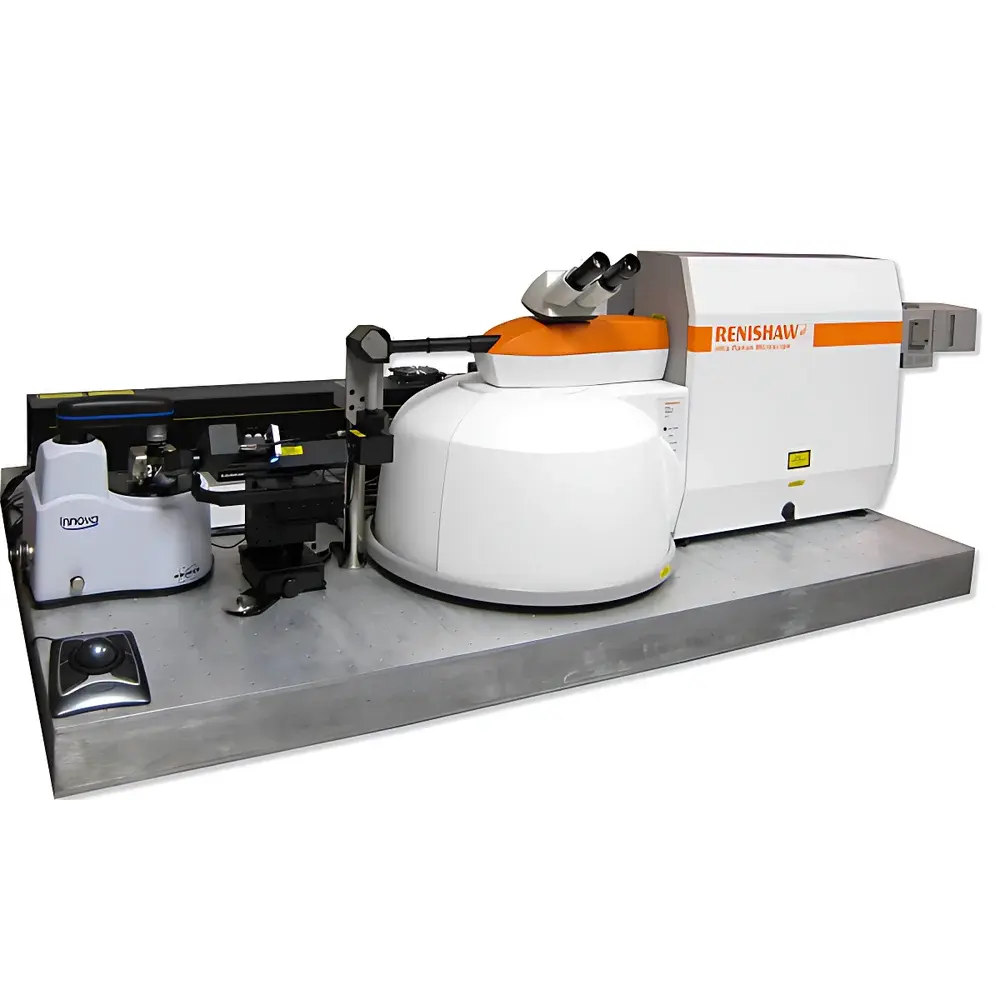
Renishaw inVia Raman-AFM Correlative Microscopy System
| Brand | Renishaw |
|---|---|
| Origin | United Kingdom |
| Model | inVia Raman-AFM |
| Instrument Type | Confocal Micro-Raman Spectrometer with Integrated Atomic Force Microscopy |
| Spectral Range | 100–4000 cm⁻¹ |
| Spectral Resolution | ≤1 cm⁻¹ |
| Spatial Resolution | XY ≈ 1 µm, Z ≈ 2 µm |
| Low-Wavenumber Capability | down to 10 cm⁻¹ |
| Spectral Reproducibility | ≤0.1 cm⁻¹ |
| Coupling Architecture | Modular optical bridge for direct integration with third-party AFM/SPM platforms (e.g., Bruker Nano Surfaces, Nanonics, NT-MDT, JPK, Park Systems) |
Overview
The Renishaw inVia Raman-AFM Correlative Microscopy System is an engineered platform for nanoscale multimodal characterization, combining confocal micro-Raman spectroscopy with atomic force microscopy (AFM) in a single, spatially registered measurement environment. Based on the principle of inelastic light scattering (Raman effect), the system delivers vibrational fingerprint spectra that reveal molecular composition, crystallinity, stress/strain states, and phase distribution. Simultaneously, the integrated AFM module acquires topographic, mechanical (e.g., modulus, adhesion), and electrical (e.g., surface potential, conductivity) data with sub-nanometer vertical resolution. Unlike sequential or post-hoc correlation methods, this system enables true in situ, real-time co-localized acquisition—eliminating sample repositioning errors and enabling dynamic process monitoring (e.g., electrochemical reactions, thermal transitions, or mechanical deformation) at fixed nanoscale coordinates.
Key Features
- Direct optical coupling via Renishaw’s proprietary flexible beam-bridge architecture, enabling seamless integration with commercial AFM/SPM platforms without compromising native performance of either subsystem.
- Confocal optical design with motorized XYZ stage and piezo-scanner for diffraction-limited spatial resolution (XY ≈ 1 µm, Z ≈ 2 µm) and high signal-to-noise spectral acquisition.
- Extended low-wavenumber capability (down to 10 cm⁻¹), essential for studying lattice modes, interlayer vibrations in 2D materials, and phonon softening in phase transitions.
- Spectral stability maintained at ≤0.1 cm⁻¹ reproducibility over multi-hour sessions—critical for quantitative comparative studies and long-term drift-corrected mapping.
- TERS (Tip-Enhanced Raman Spectroscopy) readiness: compatible with conductive AFM probes and plasmonically active tips for chemical mapping at <50 nm spatial resolution under ambient or controlled environments.
- Modular laser selection (325 nm, 532 nm, 633 nm, 785 nm) with automated wavelength switching and power stabilization for optimized resonance enhancement and fluorescence suppression across diverse material classes.
Sample Compatibility & Compliance
The system accommodates solid, thin-film, and layered samples—including semiconductors, 2D materials (graphene, TMDCs), polymers, biological tissues, battery electrodes, and catalytic nanoparticles—without requiring conductive coating or vacuum. All optical and mechanical components comply with IEC 61000-6-3 (EMC) and IEC 61000-6-2 (immunity) standards. Data acquisition workflows support GLP/GMP-aligned documentation practices; audit trails, user access controls, and electronic signature capabilities are configurable within Renishaw’s WiRE software to meet FDA 21 CFR Part 11 requirements where deployed in regulated QC/QA laboratories.
Software & Data Management
Controlled by Renishaw’s WiRE™ 5.x software suite, the platform provides synchronized acquisition, real-time overlay of Raman maps onto AFM height/phase images, and pixel-by-pixel multivariate analysis (PCA, cluster analysis, curve fitting). Raw spectral and topographic datasets are stored in vendor-neutral HDF5 format with embedded metadata (laser power, objective, grating, integration time, tip type). Batch processing scripts (Python API) enable automated spectral preprocessing, baseline correction, and statistical mapping—facilitating high-throughput correlative analysis across large-area scans or time-series experiments.
Applications
- Nanoscale heterogeneity analysis in perovskite solar cells: correlating local strain (Raman peak shift) with grain boundary morphology (AFM phase contrast).
- In situ lithiation/delithiation dynamics in Li-ion battery cathodes: tracking phase evolution (Raman band intensity ratios) alongside volume change (AFM height variation) during electrochemical cycling.
- Defect identification in hexagonal boron nitride: distinguishing vacancy-related modes (Raman) from topographic pits and charge accumulation (Kelvin probe AFM).
- Polymer blend phase separation: quantifying domain size distribution (AFM) against chemical identity (Raman spectral unmixing) at sub-micron scale.
- Biological membrane mechanics and lipid composition: simultaneous force-distance curves (AFM) and cholesterol-specific Raman bands (e.g., 1440 cm⁻¹ CH₂ scissoring) on supported bilayers.
FAQ
Can the inVia and AFM operate independently after integration?
Yes—the optical coupling is non-invasive and mechanically decoupled; both subsystems retain full standalone functionality, including manufacturer-specific automation and calibration routines.
Is TERS capability built-in or requires additional hardware?
TERS is enabled via optional accessories: plasmonically enhanced AFM probes, laser polarization control modules, and near-field alignment fixtures—all supported under Renishaw’s application engineering service.
What AFM manufacturers are officially validated for integration?
Renishaw provides integration kits and alignment protocols for Bruker Nano Surfaces (Dimension Icon, Resolve), Nanonics MV400, NT-MDT NTEGRA, JPK NanoWizard, and Park Systems XE-series platforms.
Does the system support cryogenic or environmental chamber operation?
Yes—customizable vacuum-compatible and temperature-controlled stages (80–400 K) are available; optical path design allows for integration with glovebox-enclosed AFM chambers for air-sensitive samples.
How is spectral calibration maintained during long-duration correlative mapping?
Automated daily calibration using internal Ne/Ar lamp references and real-time CCD temperature stabilization ensure wavenumber accuracy remains within ±0.05 cm⁻¹ across 12+ hour acquisitions.

")

")