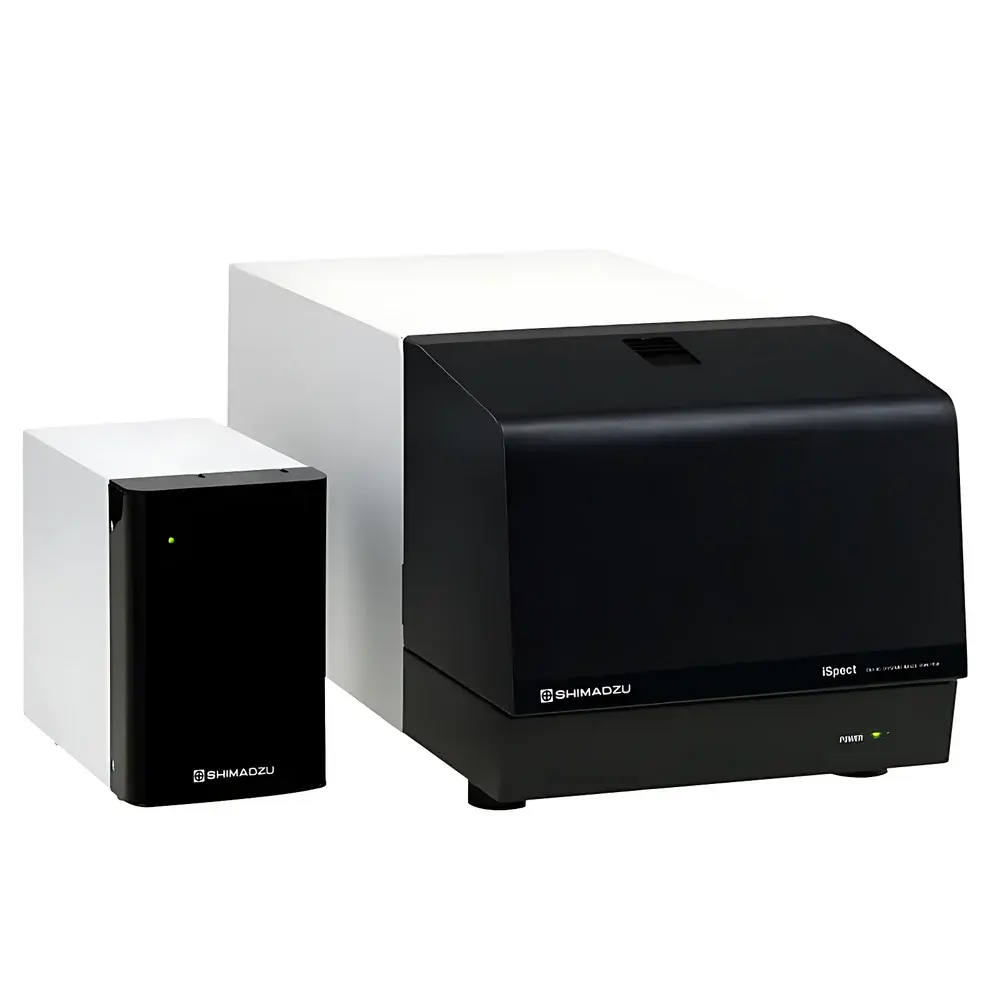
Shimadzu DIA-10 Dynamic Image-Based Particle Size and Shape Analyzer
| Brand | Shimadzu |
|---|---|
| Origin | Japan |
| Manufacturer Type | Original Equipment Manufacturer (OEM) |
| Import Status | Imported |
| Model | DIA-10 |
| Instrument Type | Dynamic |
| Number of Lenses | 1 |
| Measurement Range | 5–100 µm |
| Dispersion Method | Wet Dispersion |
| Measured Parameters | Area-equivalent Diameter, Perimeter-equivalent Diameter, Maximum Length, Maximum Orthogonal Length, Feret Diameter (Vertical), Feret Diameter (Horizontal), Particle Perimeter, Convex Hull Perimeter, Circularity, Aspect Ratio, Bounding Rectangle Aspect Ratio |
Overview
The Shimadzu DIA-10 Dynamic Image-Based Particle Size and Shape Analyzer is an engineered solution for real-time, high-fidelity morphological characterization of particulate systems in liquid suspension. Operating on the principle of dynamic flow imaging—where particles pass individually through a precisely defined optical detection zone—the DIA-10 captures high-contrast silhouette images at controlled flow rates. Unlike static image analysis systems requiring sedimentation or manual field selection, the DIA-10 employs a microfluidic flow cell coupled with telecentric optics to ensure consistent magnification across the entire field of view. This eliminates perspective distortion and parallax error, enabling traceable, ISO 13322-2 compliant size and shape quantification without reliance on statistical extrapolation or calibration beads. The system is designed for laboratories requiring regulatory-grade data integrity in pharmaceutical suspension development, catalyst quality control, battery slurry monitoring, and advanced ceramic precursor evaluation.
Key Features
- Telecentric optical path: Maintains constant magnification regardless of particle position within the depth of field—critical for accurate Feret and convex hull measurements per ISO 9276-6.
- Integrated microfluidic flow cell: Enables laminar, single-particle transit with minimal shear-induced agglomeration or deformation during measurement.
- Automated focus stabilization: Real-time contrast-based autofocus ensures optimal edge definition across variable particle refractive indices and concentrations.
- Simultaneous counting and morphometry: Each detected particle yields ≥12 standardized descriptors—including circularity (4π·Area/Perimeter²), aspect ratio (Max Length / Orthogonal Length), and bounding rectangle metrics—aligned with USP & Ph. Eur. guidelines for particulate matter testing.
- Robust architecture: All-optical design with no moving parts in the imaging path; sealed fluidic interface compatible with aqueous and low-viscosity organic dispersants.
Sample Compatibility & Compliance
The DIA-10 supports wet-dispersed samples across a broad range of industrial and research applications—including API suspensions, pigment dispersions, nanocellulose colloids, and electrode slurries. Sample introduction uses standard 10–1000 µL pipette tips mounted directly onto the instrument’s fluidic port, minimizing carryover and enabling rapid method transfer between operators. The system complies with key international standards for image-based particle analysis: ISO 13322-2 (method validation), ISO 9276-6 (shape descriptor definitions), and ASTM E2457 (microscopic particle counting). Data acquisition and reporting support audit trails, electronic signatures, and user-access controls aligned with FDA 21 CFR Part 11 and EU Annex 11 requirements for regulated environments.
Software & Data Management
Shimadzu’s proprietary iSpect Analysis Suite provides full control over acquisition parameters—including exposure time, frame rate, flow velocity, and trigger thresholds—as well as post-acquisition filtering based on size, shape, or intensity criteria. Raw image archives are stored with embedded metadata (timestamp, operator ID, instrument serial number, dispersion protocol), ensuring full traceability. Batch processing enables comparative analysis across multiple runs using customizable report templates compliant with GLP/GMP documentation workflows. Export options include CSV (for statistical process control integration), TIFF (lossless image stacks), and PDF summary reports with embedded histograms, scatter plots (e.g., circularity vs. area-equivalent diameter), and outlier flagging.
Applications
- Pharmaceutical QC: Quantitative assessment of undissolved particles in injectables per USP and , including identification of fiber-like or crystalline contaminants via shape clustering.
- Battery R&D: Monitoring graphite or silicon anode slurry homogeneity, detecting agglomerates >10 µm that may cause electrode defects or dendrite nucleation.
- Food & Beverage: Characterizing starch granule breakdown during enzymatic hydrolysis or emulsion droplet coalescence in dairy alternatives.
- Materials Science: Correlating sintering behavior of metal powders with initial particle elongation (aspect ratio) and surface roughness proxies (perimeter-to-area ratio).
- Environmental Analysis: Differentiating biogenic vs. anthropogenic microplastics in water extracts using multivariate shape fingerprinting.
FAQ
What sample volume is required per analysis?
Typical analysis uses 50–200 µL of well-dispersed suspension; total fluidic path volume is <15 µL, minimizing reagent consumption.
Can the DIA-10 measure dry powders?
No—this is a wet-dispersion-only system optimized for liquid-phase dynamic imaging; dry powder analysis requires complementary static image or laser diffraction methods.
Is calibration traceable to NIST standards?
Yes—system verification includes certified polystyrene microsphere reference materials (NIST SRM 1960 series) for size accuracy and resolution validation.
How does the DIA-10 handle overlapping or clustered particles?
Advanced segmentation algorithms apply watershed splitting and convex hull erosion to resolve partial overlaps; users can configure minimum separation thresholds and reject merged events automatically.
Does the software support automated pass/fail decision logic?
Yes—customizable acceptance criteria can be defined per parameter (e.g., “circularity 50 µm”) to generate real-time compliance flags during acquisition.


