SpectrumTEQ-EL Electroluminescent Quantum Yield Measurement System by Ocean Optics
| Brand | Ocean Optics |
|---|---|
| Origin | USA |
| Model | SpectrumTEQ-EL |
| Spectral Range | 350–1100 nm |
| Detector | CCD |
| Optical Resolution | 2.5 nm (FWHM) |
| Sensitivity | 0.14–7.7 nm (wavelength-dependent responsivity) |
| Signal-to-Noise Ratio | 1000:1 |
| Dynamic Range | 85,000:1 (typical, single acquisition, QEPro) |
| Stray Light | <0.08% at 600 nm |
| Integrating Sphere Diameter | 3.3" or 1.5" |
| Sphere Coating | Spectralon® |
| Source Meter | Keithley 2400 |
| Fiber Core Diameter | 1000 µm (interchangeable) |
| Calibration Standard | HL-3-INT-CAL 2π geometry, 50 lm, 5 W |
| AD Resolution | 18-bit (QEPro), 16-bit (QE65Pro) |
| Software | SpectrumTEQ-EL dedicated application |
Overview
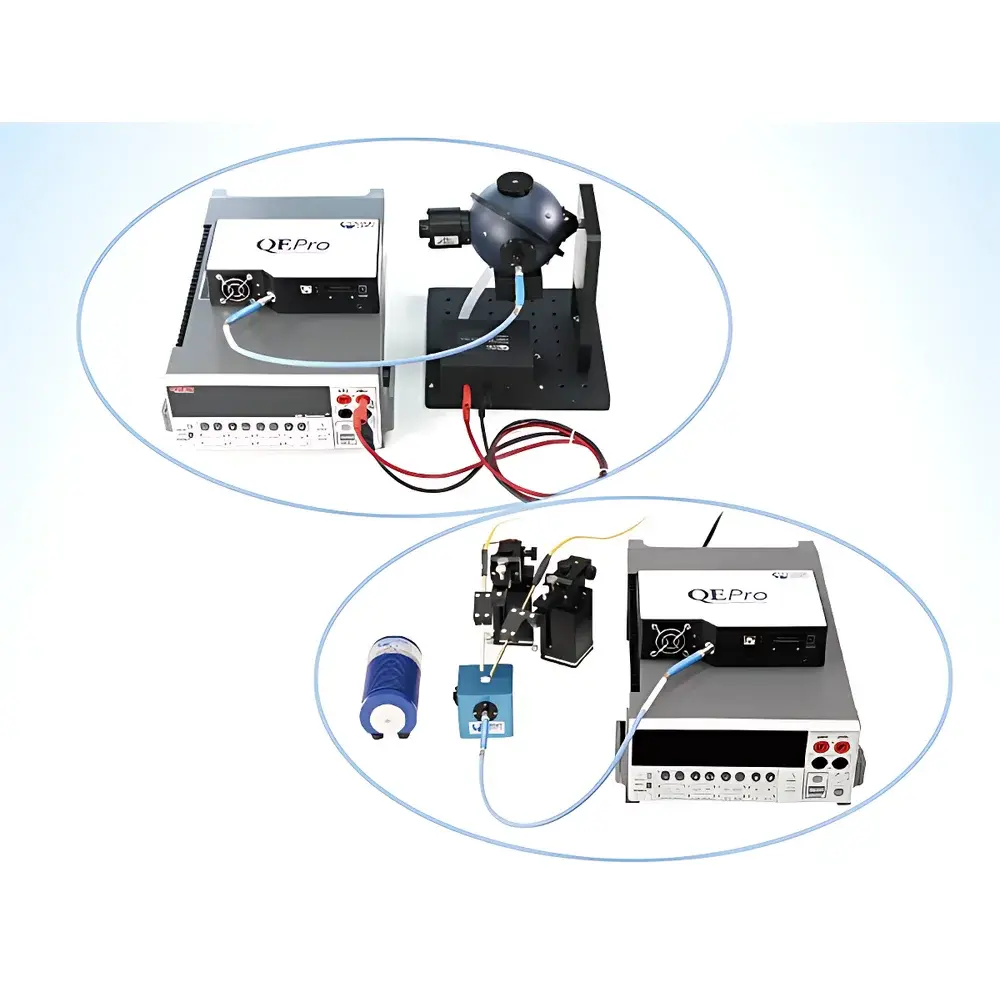
The SpectrumTEQ-EL Electroluminescent Quantum Yield Measurement System is a turnkey optical metrology platform engineered for the precise, traceable quantification of external quantum efficiency (EQE) and photometric parameters of electroluminescent (EL) devices under operational bias. Built upon Ocean Optics’ high-performance QEPro fiber-optic spectrometer, the system implements absolute spectral radiance calibration via NIST-traceable 2π-integrating sphere geometry and calibrated halogen reference sources. It operates on the principle of simultaneous electrical stimulus (via integrated Keithley 2400 source measure unit) and spectrally resolved photon flux capture—enabling calculation of EQE as the ratio of emitted photons per injected electron, corrected for spectral responsivity, sphere throughput, and detector quantum efficiency across 350–1100 nm. Designed for laboratory and R&D environments in academia and industry, it supports rigorous characterization of emissive layers in OLEDs, QLEDs, PeLEDs, thin-film EL devices, and inorganic LEDs without requiring vacuum or cryogenic infrastructure.
Key Features
- Integrated electroluminescence quantum yield measurement with synchronized current/voltage sourcing and spectral acquisition
- High-fidelity spectral detection using QEPro spectrometer: 18-bit ADC, 1000:1 SNR, <0.08% stray light at 600 nm, and 2.5 nm FWHM resolution ensures accurate peak shape and spectral centroid determination
- Modular integrating sphere options (3.3″ or 1.5″ diameter) with Spectralon® coating for uniform diffuse reflectance (>99% @ 400–1500 nm) and minimal angular dependence
- Traceable 2π calibration architecture compliant with CIE S 025/E:2015 and ISO/CIE 19476:2014 for luminous and radiant flux measurements
- Full electrical parameter logging (I–V curves, power dissipation) alongside photometric outputs (luminous flux, radiometric flux, CIE 1931 chromaticity coordinates, dominant wavelength, color rendering index)
- Compact benchtop footprint (<45 cm × 35 cm × 25 cm) enabling glovebox integration for inert-atmosphere device testing
Sample Compatibility & Compliance
The SpectrumTEQ-EL accommodates planar emissive samples up to 25 mm × 25 mm mounted on standard probe stations or custom fixtures. It supports DC and pulsed bias operation (with user-defined duty cycle and frequency), making it suitable for transient EL analysis and degradation studies. All optical components meet RoHS directives, and the integrating sphere assembly complies with ISO 13406-2 for diffuse reflectance stability over time. The system’s calibration traceability aligns with ISO/IEC 17025 requirements when operated within validated environmental conditions (23 ± 2 °C, <50% RH). Data integrity conforms to FDA 21 CFR Part 11 principles through audit-trail-enabled software logging, electronic signatures, and immutable raw-data archiving.
Software & Data Management
SpectrumTEQ-EL software provides a guided, wizard-based workflow—from hardware initialization and dark/reference calibration to automated EQE sweep generation across user-defined current density ranges (e.g., 0.1–1000 mA/cm²). All acquired spectra are stored in HDF5 format with embedded metadata (timestamp, instrument configuration, calibration ID, ambient temperature). Batch processing enables comparative analysis of multiple devices or aging timepoints. Export options include CSV (for Excel/Python), CIE xyY, and IESNA LM-63 files. The software supports GLP-compliant reporting with customizable templates that include uncertainty propagation estimates derived from spectrometer noise floor, sphere throughput variance, and source meter accuracy specifications.
Applications
- Quantitative EQE mapping of solution-processed OLED emitters and host-dopant systems
- Efficiency roll-off analysis in high-brightness micro-LED arrays
- Comparative assessment of triplet harvesting in thermally activated delayed fluorescence (TADF) materials
- Stability testing under constant-current stress with real-time spectral drift monitoring
- Validation of encapsulation effectiveness via in-situ EL decay kinetics in nitrogen-purged gloveboxes
- Correlation of electroluminescent spectra with photoluminescence quantum yield (PLQY) measured on identical films
FAQ
What standards does the SpectrumTEQ-EL comply with for quantum yield reporting?
It follows the methodology outlined in CIE Publication 127:2007 and ASTM E308-19 for spectral irradiance-based EQE derivation, with calibration traceable to NIST SRM 2031 and 2032.
Can the system measure internal quantum efficiency (IQE)?
No—IQE requires additional optical modeling (e.g., outcoupling factor estimation via ray tracing or angular-resolved EL), which is outside the scope of this hardware-limited platform. IQE must be inferred externally.
Is spectral recalibration required between sample measurements?
No—the system uses a stable internal halogen reference lamp and fixed optical path; only periodic verification (e.g., monthly) against the HL-3-INT-CAL standard is recommended per ISO/IEC 17025.
Does the software support automated compliance reporting for regulatory submissions?
Yes—customizable PDF reports include full instrument configuration logs, raw spectral data links, uncertainty budgets, and electronic sign-off fields aligned with GMP documentation practices.
What is the minimum detectable current density for reliable EQE extraction?
With optimized integration time and dark subtraction, reproducible EQE values are attainable down to 0.05 mA/cm² for high-efficiency green phosphorescent OLEDs, subject to device active area and sphere coupling efficiency.

")