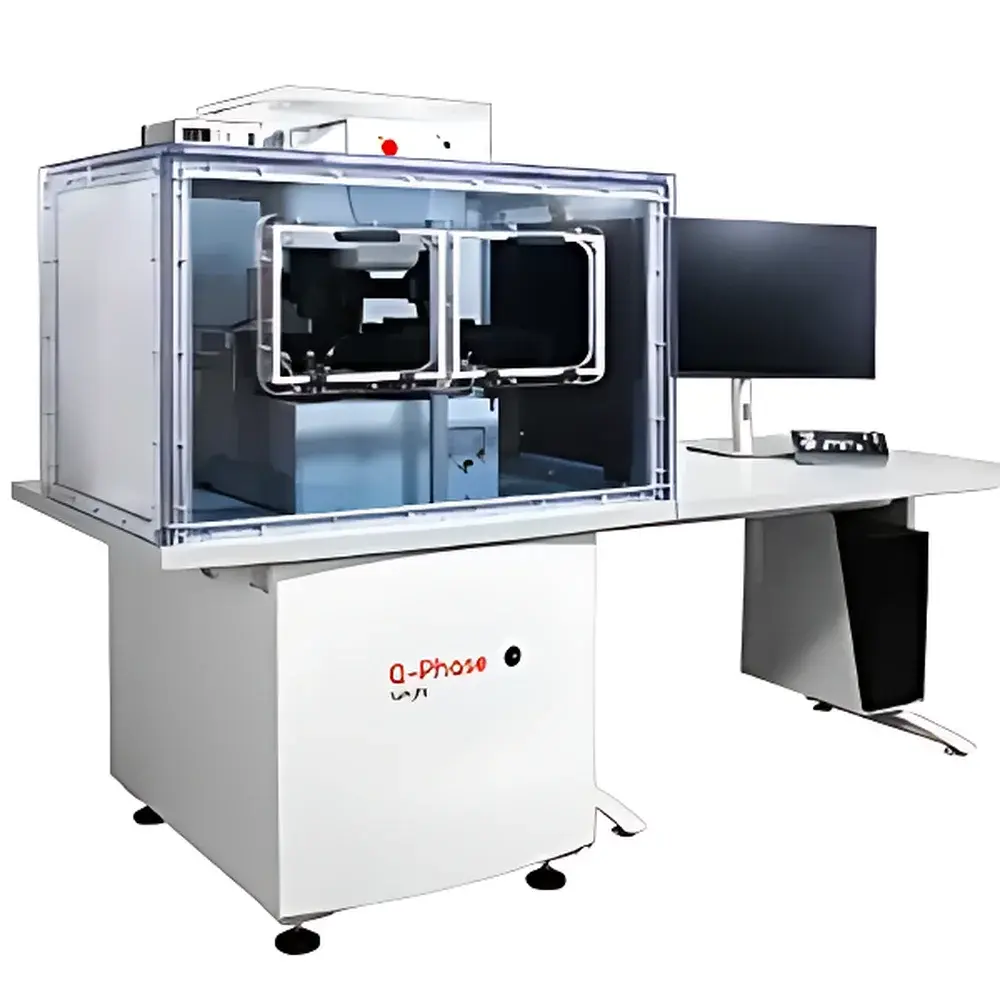
Telight Q-Phase Coherence-Controlled Holographic Microscope
| Brand | Telight |
|---|---|
| Origin | France |
| Model | Q-Phase |
| Type | Coherence-Controlled Holographic Microscope (CCHM) for Quantitative Phase Imaging (QPI) |
| Imaging Modes | QPI, Fluorescence, DIC, Brightfield, High-Pass Filtered Phase |
| Automation | Fully Automated Time-Lapse, Multi-Position, Multi-Channel, Z-Stack Acquisition & Segmentation |
| Detection Principle | Laser Interferometric Holography with Spatial Coherence Control |
| Cell Compatibility | Live, Unfixed, Unstained, 3D-Matrix Embedded Cells |
| Data Output | Quantitative Phase Maps (nm), Dry Mass (pg), Morphometric Parameters (Area, Perimeter, Thickness, Asymmetry), Temporal Dynamics (ms–hr scale) |
| Regulatory Context | Designed for GLP-compliant research |
Overview
The Telight Q-Phase is a coherence-controlled holographic microscope engineered for label-free, quantitative live-cell analysis at the single-cell and subcellular level. Unlike conventional optical microscopy techniques that rely on exogenous contrast agents or fluorescent probes, Q-Phase implements laser interferometric holography with dynamically controlled spatial coherence to reconstruct high-fidelity quantitative phase images (QPI) in real time. This principle enables direct, non-invasive measurement of optical path length differences across transparent biological specimens—translating into precise, pixel-resolved maps of cellular dry mass (in picograms), thickness (in nanometers), and refractive index distribution. The system operates without phototoxicity or photobleaching, making it uniquely suited for long-term time-lapse studies of sensitive primary cells, stem cells, and 3D tissue models. Its physical foundation lies in off-axis digital holographic microscopy (DHM), enhanced by Telight’s proprietary coherence gating algorithm, which suppresses speckle noise and scattering artifacts—particularly critical when imaging cells embedded in collagen matrices or other optically heterogeneous environments.
Key Features
- Coherence-controlled holographic imaging: Eliminates coherence noise while preserving phase sensitivity, enabling stable QPI acquisition even under variable environmental conditions (e.g., temperature drift, mechanical vibration)
- Quantitative phase contrast (QPC) mode: Delivers absolute optical path difference (OPD) maps with <1 nm height resolution and sub-pg dry mass sensitivity per pixel
- Multi-modal correlative imaging: Seamless integration of QPI with fluorescence, DIC, and brightfield—each channel registered to the same coordinate frame for pixel-accurate overlay and cross-modal phenotyping
- High-throughput automated segmentation: GPU-accelerated cell detection and boundary delineation based on phase gradient and mass distribution, supporting concurrent tracking of >5,000 cells per field of view
- Optimized time-lapse architecture: Motorized stage with sub-micron repeatability, piezo-driven Z-focus control, and programmable exposure sequencing for multi-day, multi-position experiments with minimal thermal load
- Native 3D matrix compatibility: Resolves individual cells within turbid, scattering environments—including type I collagen gels, Matrigel™, and hydrogel scaffolds—without optical clearing or labeling
Sample Compatibility & Compliance
The Q-Phase system is validated for use with adherent and suspension mammalian cells (including PC-3, NMuMG, HT1080, and human embryonic stem cells), primary isolates (e.g., dermal fibroblasts, spermatozoa), and biopsy-derived carcinoma specimens. It accommodates standard culture formats: glass-bottom dishes (No. 1.5 coverslip), chambered slides, and microfluidic devices with optical access. All imaging protocols are compatible with physiological CO2/humidity/temperature incubation enclosures. From a regulatory standpoint, the Q-Phase platform supports Good Laboratory Practice (GLP) workflows: raw hologram data is stored in vendor-neutral TIFF/OME-TIFF format with embedded metadata (acquisition timestamp, objective ID, laser power, focus position); optional software modules provide electronic signatures, user access logs, and audit trail generation compliant with FDA 21 CFR Part 11 requirements. While not a clinical diagnostic device, its quantitative outputs align with ISO/IEC 17025 principles for measurement traceability in preclinical research settings.
Software & Data Management
Q-Phase is operated via Telight’s Q-Analyzer software suite—a modular, scriptable platform built on Python and Qt. Core capabilities include: (1) real-time hologram reconstruction with adaptive background subtraction; (2) batch processing of time-series datasets using customizable segmentation pipelines (e.g., threshold-based, machine learning–assisted, or hybrid morpho-phase classifiers); (3) export of standardized metrics—dry mass, projected area, circularity, aspect ratio, nuclear/cytoplasmic mass ratio, migration velocity, and mitotic duration—to CSV, HDF5, or SQL databases; (4) integration with third-party analysis tools (Fiji/ImageJ, MATLAB, Python scikit-image) via open API. Data provenance is enforced through immutable acquisition metadata embedding and version-controlled analysis scripts. For collaborative environments, the software supports role-based permissions and centralized project repositories synchronized via secure SFTP or local NAS.
Applications
- Tumor cell biophysics: Monitoring entosis-mediated mass transfer, oxidative stress-induced dry mass redistribution, and drug-induced cytostatic/cytotoxic transitions in prostate and breast cancer lines—without perturbing endogenous signaling pathways
- Stem cell dynamics: Quantifying dry mass accumulation rates during pluripotency exit, lineage commitment, and organoid formation; correlating phase-derived morphokinetic parameters with transcriptomic states
- Sperm motility and viability assessment: Label-free classification of sperm subpopulations based on head morphology, midpiece phase retardation, and flagellar beat amplitude—validated against WHO 2021 semen analysis criteria
- 3D invasion assays: Tracking mesenchymal migration, pseudopod extension, and localized mass deposition in collagen I matrices at sub-minute temporal resolution
- Cell cycle phenotyping: Defining G1/S/G2/M transitions via dry mass doubling kinetics and phase-derived nuclear condensation metrics—eliminating reliance on FUCCI reporters or thymidine analogs
FAQ
What distinguishes Q-Phase from conventional phase-contrast or DIC microscopes?
Q-Phase delivers quantitative, absolute phase measurements—not qualitative contrast. It provides numerically calibrated dry mass (pg), thickness (nm), and refractive index maps, whereas phase-contrast and DIC yield only relative intensity variations with no physical units.
Can Q-Phase image cells inside thick 3D matrices like collagen gels?
Yes. Its coherence-gating architecture rejects multiply scattered light, enabling clear visualization and segmentation of individual cells at depths up to 150 µm in fibrillar collagen I gels—without optical clearing or refractive index matching.
Is fluorescence required for cell identification or segmentation?
No. QPI alone achieves robust, label-free segmentation based on intrinsic phase gradients and mass distribution. Fluorescence is optional and used only for correlative validation or multi-parameter phenotyping.
How does Q-Phase handle focus drift during long-term time-lapse experiments?
It integrates hardware-based autofocus via infrared reflection sensing at the coverslip interface, coupled with software-driven focus correction algorithms that maintain sub-200 nm axial stability over 72+ hours.
Are raw holograms and processed QPI data exportable for offline analysis?
Yes. All raw interferograms and reconstructed phase maps are saved in open, documented formats (TIFF with OME metadata), fully compatible with custom Python, MATLAB, or ImageJ pipelines.


