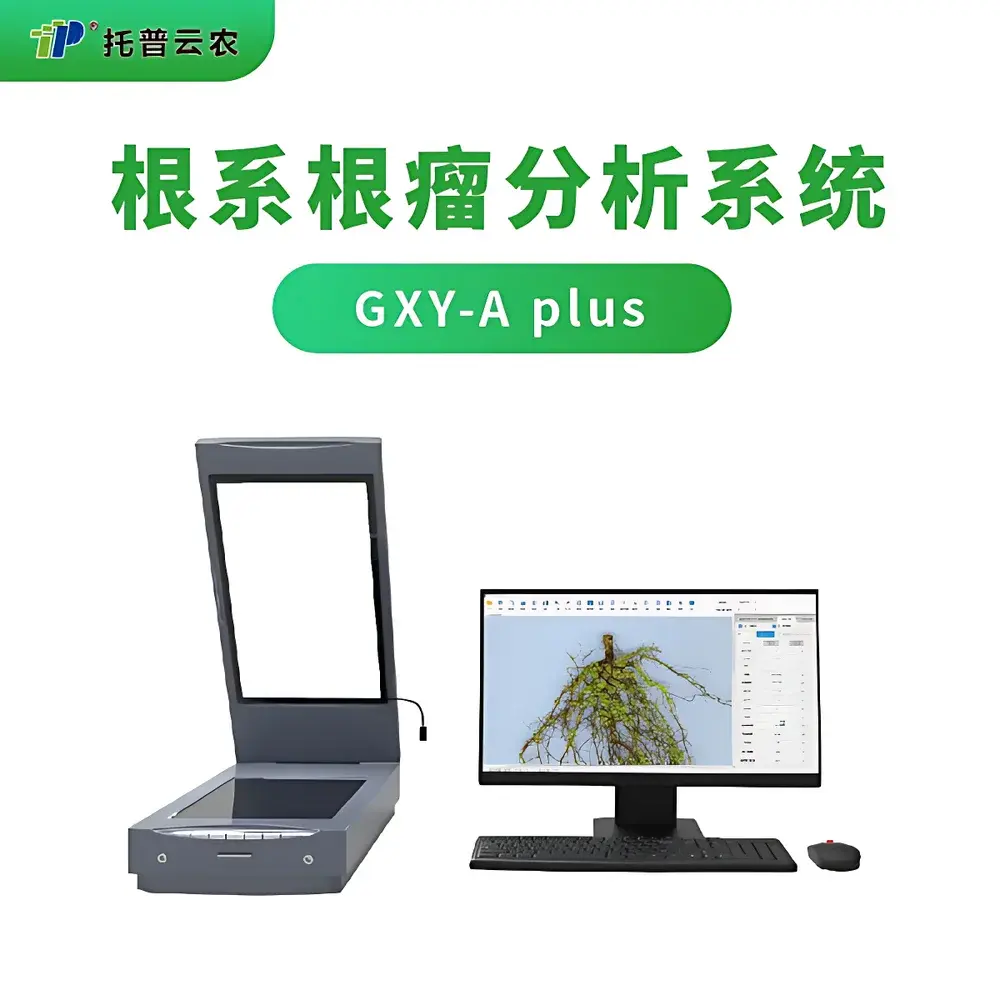
Top Cloud-agri GXY-A Plus Root Nodule and Root System Image Analysis System
| Brand | Top Cloud-agri |
|---|---|
| Origin | Zhejiang, China |
| Manufacturer Type | Direct Manufacturer |
| Model | GXY-A Plus |
| Compliance | ISO/IEC 17025-aligned workflow support |
| Software Validation | Audit-trail enabled, 21 CFR Part 11–compatible data export & user authentication |
| Measurement Principle | High-resolution digital image acquisition + machine vision–based segmentation and morphometric feature extraction (RGB channel decomposition, Otsu thresholding, skeletonization, topological graph analysis) |
Overview
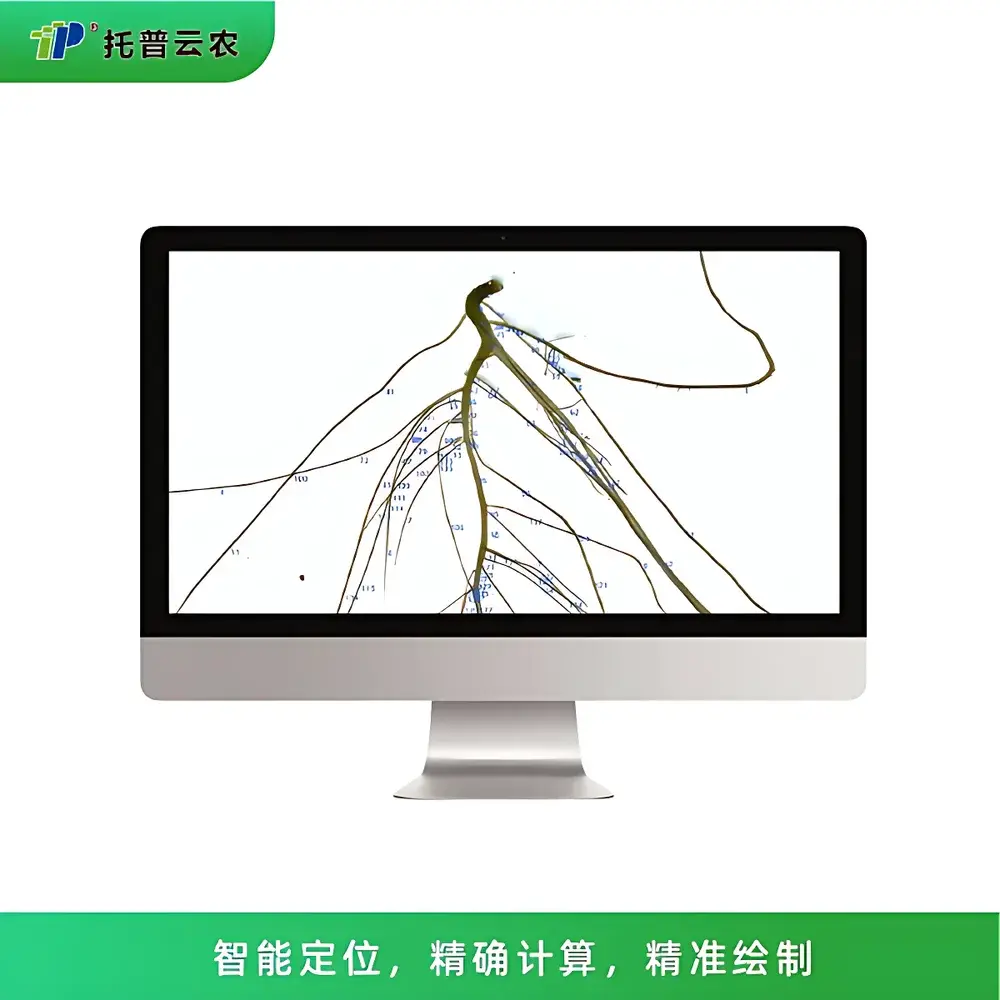
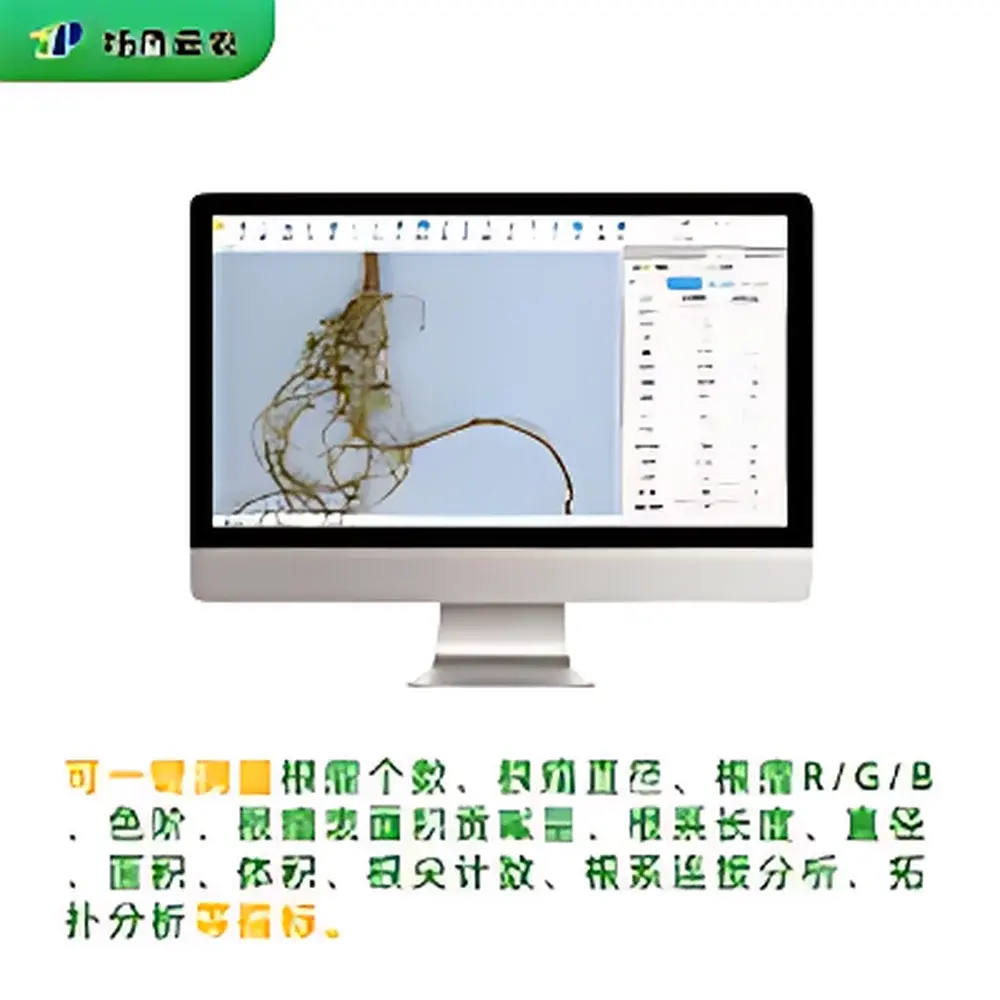
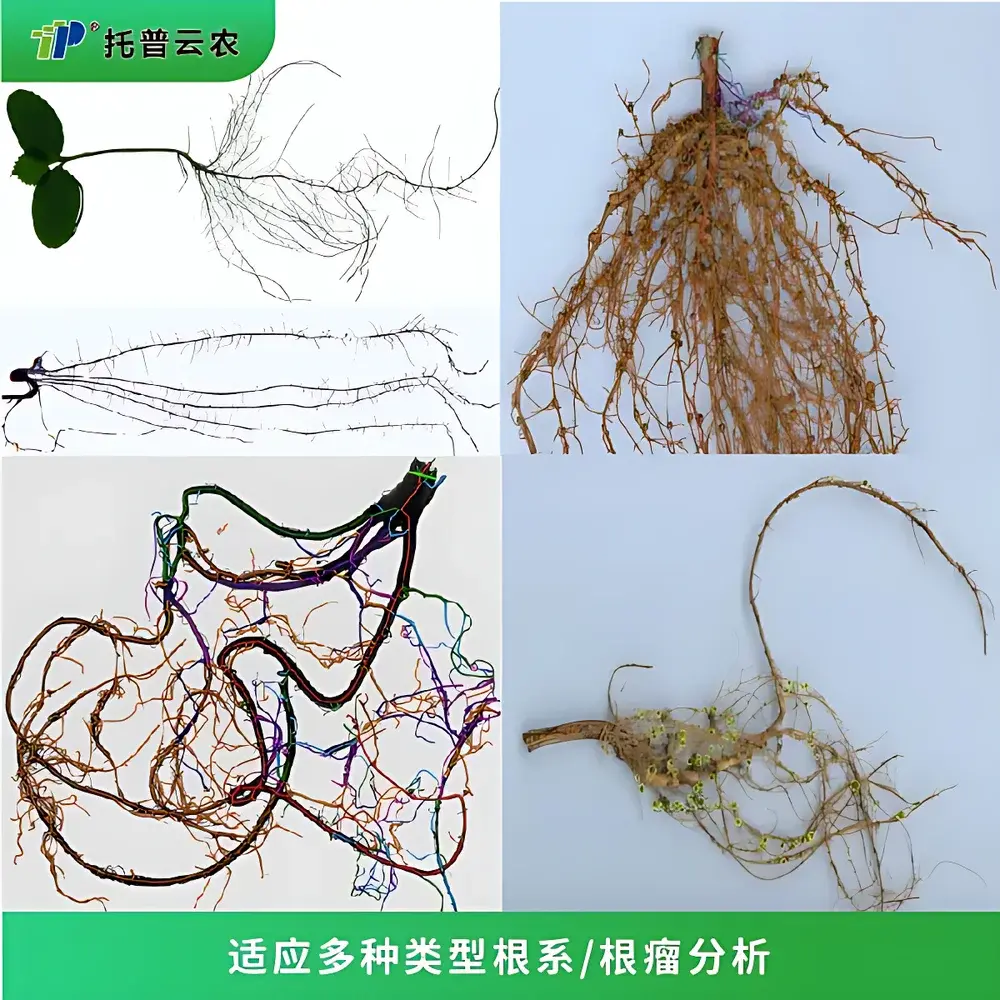
The Top Cloud-agri GXY-A Plus Root Nodule and Root System Image Analysis System is a dedicated digital phenotyping platform engineered for quantitative root architecture and symbiotic nodule characterization in leguminous species. It operates on a validated computer vision pipeline that integrates high-fidelity flatbed scanning (A4+ format, 215.9 × 355.6 mm active area) with multi-stage image processing: adaptive RGB color space decomposition, dynamic Otsu-based binarization, morphological noise suppression, skeletonization, and graph-theoretic root topology reconstruction. Unlike generic image analyzers, the GXY-A Plus implements nodule-specific detection algorithms trained on annotated datasets of soybean (Glycine max) and peanut (Arachis hypogaea) root systems—enabling simultaneous quantification of both structural root traits (e.g., total length, branching angles, tip count, volume) and functional symbiotic features (nodule count, equivalent diameter, chromatic R/G/B distribution, color gradient mapping). The system is designed to replace labor-intensive manual tracing and counting protocols while maintaining metrological traceability suitable for GLP-compliant plant physiology studies, breeding program trait screening, and rhizobiology research under controlled or semi-field conditions.
Key Features
- Legume-optimized nodule detection engine with >95% recognition accuracy (RSD <5%) across diverse nodule morphologies—validated against ground-truth manual counts per ASTM D7298-22 guidelines for biological image validation.
- Multi-layer correction suite: automated branch merging, root tip consolidation, main root reorientation, diameter smoothing, and false-positive nodule deletion—each operation logged with timestamp and operator ID for audit compliance.
- Batch processing capacity: ≥100 root images per session; auto-saves intermediate results and resumes from last checkpoint upon interruption.
- Configurable visualization: toggle overlays for root tips (green), junctions (yellow), nodules (magenta), primary roots (blue), lateral roots (cyan), and connection segments—exportable as layered TIFF or PNG with embedded scale bar and metadata.
- Dynamic background subtraction: pixel-intensity thresholding filters non-root debris without compromising fine root hair resolution.
- Fully encrypted software environment: dual-layer protection via hardware dongle + time-limited dynamic QR code authentication; tied to registered institutional credentials.
Sample Compatibility & Compliance
The GXY-A Plus accommodates washed, spread root systems imaged on white background paper or transparent trays—compatible with hydroponic, agar plate, soil-grown (with gentle washing), and rhizotron-derived samples. It supports grayscale and 24-bit RGB input at up to 600 dpi native resolution. All measurement outputs—including nodule count (0–5000), equivalent spherical diameter (0–15 mm), total root length (±4% error), tip count (±5% error), projected surface area (±4% error), and volumetric estimate (±4% error)—are traceable to internal calibration standards verified per ISO 5725-2:2019 repeatability protocols. Data export modules comply with FDA 21 CFR Part 11 requirements for electronic records, including full audit trails, electronic signatures, and immutable timestamped logs.
Software & Data Management
The proprietary RootQuant™ software (v4.2+) provides an integrated environment for acquisition, analysis, annotation, and reporting. All operations are recorded in a relational SQLite database with automatic versioning. Raw images, binary masks, skeleton graphs, and CSV-formatted trait tables are stored with SHA-256 checksums. Excel exports include embedded formulas for derived indices (e.g., specific root length, nodule density per cm root length). Cloud synchronization uses TLS 1.3–encrypted HTTPS endpoints to Top Cloud-agri’s ISO 27001–certified research cloud—enabling cross-institutional collaboration, role-based access control, and long-term archival with WORM (Write Once Read Many) policy enforcement.
Applications
- Rhizobium–legume symbiosis phenotyping: high-throughput screening of nodule number, size distribution, and spatial clustering along root axes.
- Root architectural QTL mapping: precise quantification of branching frequency, link length, and topological complexity for genetic association studies.
- Abiotic stress response profiling: longitudinal tracking of root elongation inhibition, tip loss, and nodule suppression under nitrogen limitation, drought, or heavy metal exposure.
- Soil–root interface modeling: generation of 2D skeletonized inputs for computational fluid dynamics (CFD) simulations of nutrient diffusion gradients.
- Educational labs: standardized root morphology datasets with instructor-annotated reference answers for undergraduate plant science curricula.
FAQ
What image formats does the GXY-A Plus accept?
TIFF, PNG, JPEG, and BMP files with 8-bit or 24-bit depth; recommended minimum resolution: 300 dpi.
Can the system distinguish between viable and senesced nodules?
Yes—via RGB chromaticity analysis: healthy nodules exhibit characteristic R/G ratios (>1.8) and narrow B-channel variance; senescence detection thresholds are configurable per species.
Is offline operation supported?
Yes—full local analysis mode without internet; cloud sync initiates only upon explicit user command or scheduled interval.
How is measurement uncertainty reported?
Per analysis batch, the software generates a QC report listing repeatability (RSD%), bias vs. reference standard, and outlier flagging based on Grubbs’ test (α = 0.05).
Does the system support third-party scanner integration?
Yes—via TWAIN and ISIS drivers; however, optimal performance requires use of the included calibrated flatbed scanner (576 × 297 × 118 mm, LED illumination, uniformity ±2%).