Top Cloud-agri TP-GTL-W Field-Deployable High-Throughput Plant Phenotyping Platform
| Brand | Top Cloud-agri |
|---|---|
| Origin | Zhejiang, China |
| Manufacturer Type | Direct Manufacturer |
| Region of Origin | Domestic (China) |
| Model | TP-GTL-W |
| Pricing | Upon Request |
Overview
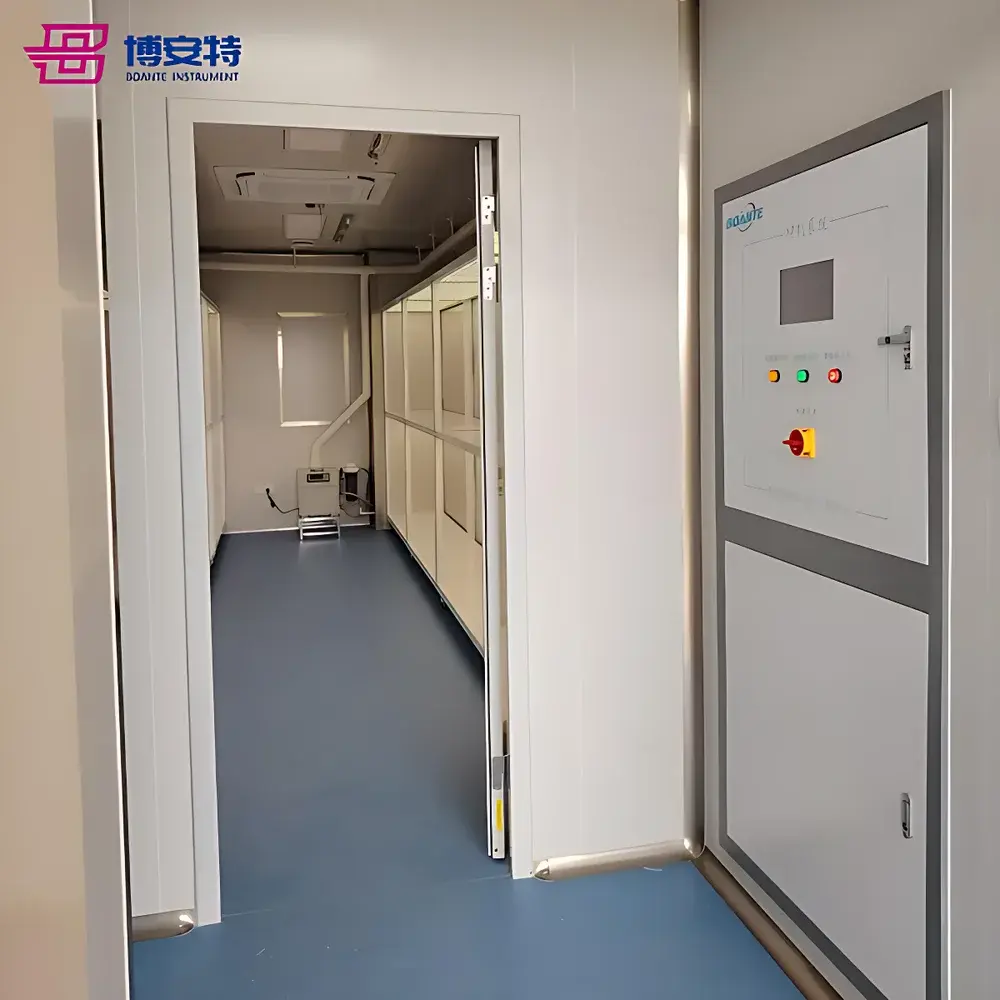
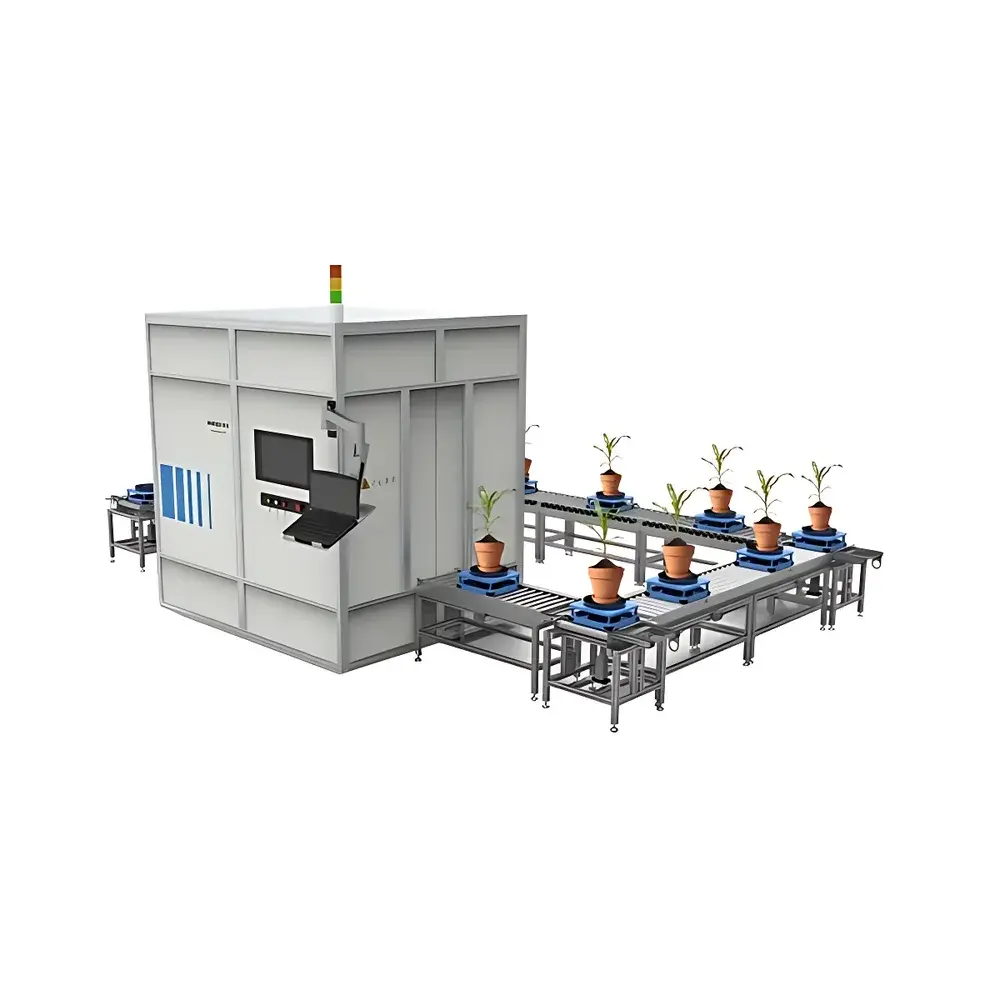
The Top Cloud-agri TP-GTL-W Field-Deployable High-Throughput Plant Phenotyping Platform is an integrated, automation-driven phenotyping system engineered for controlled-environment applications—primarily large- and medium-scale greenhouses. It operates on a conveyor-based workflow architecture, where potted plants are transported sequentially into a light-controlled imaging chamber for synchronized multi-modal data acquisition. The platform implements a plant–sensor–analysis pipeline grounded in non-invasive optical sensing principles: visible-light 2D/3D imaging leverages structured light and photogrammetric reconstruction; hyperspectral imaging utilizes push-broom scanning with high spectral fidelity across the 400–1000 nm range to quantify biochemical and biophysical traits (e.g., chlorophyll content, water status, anthocyanin accumulation). Designed for longitudinal monitoring under abiotic and biotic stress regimes—including heat, salinity, pathogen infection, and herbivory—the system enables quantitative, time-resolved characterization of morphological, textural, chromatic, and structural phenotypes at the individual-plant level.
Key Features
- Modular multimodal imaging integration: Simultaneous or sequential deployment of RGB 2D, stereo-vision 3D, and VNIR hyperspectral imaging units within a shared mechanical framework.
- Automated conveyor transport system: Precision belt-driven linear motion with ≤±2 mm positional repeatability and RFID-based per-pot identification for unambiguous sample traceability.
- Intelligent imaging orchestration: Motorized 360° rotating stage coupled with height-adjustable imaging platforms enables full circumferential capture without manual repositioning or calibration.
- Edge-enabled real-time analysis: Onboard edge computing unit executes pre-trained crop-specific phenotypic models—automatically extracting parameters such as projected leaf area, plant height, stem diameter, canopy volume, color indices (e.g., GNDVI, ExG), and hyperspectral-derived vegetation indices (e.g., PRI, MCARI).
- Integrated biometric sensing: Optional high-accuracy load cell module enables non-destructive biomass estimation during transit, synchronized with optical data streams.
- Standardized data ingestion protocol: Supports auto-matching of sensor metadata, image stacks, and derived metrics via embedded barcode/RFID linkage—ensuring audit-ready provenance for GLP-compliant studies.
Sample Compatibility & Compliance
The TP-GTL-W accommodates standard horticultural containers (7–20 cm diameter pots) and supports upright growth forms typical of model species (e.g., Arabidopsis thaliana, rice, tomato, maize seedlings) and breeding lines up to ~1.2 m height. Its modular design allows adaptation to diverse experimental layouts—including bench-top, aisle-mounted, or mobile trailer configurations. All imaging modules comply with ISO 11784/11785 (RFID standards) and IEC 61000-6-3 (EMC emissions). Hyperspectral data acquisition adheres to ASTM E1777-20 guidelines for spectral radiance calibration traceability. The system architecture supports metadata tagging aligned with MIAPPE v1.1 (Minimum Information About a Plant Phenotyping Experiment) and is compatible with FAIR data principles when deployed with compliant storage infrastructure.
Software & Data Management
The platform runs on a Linux-based embedded OS with proprietary phenotyping software suite (v4.2+), featuring a web-accessible dashboard for remote monitoring and job scheduling. Raw image data (TIFF/RAW), processed feature tables (CSV/Parquet), and 3D mesh files (OBJ/GLTF) are automatically archived in hierarchical directory structures timestamped and indexed by experiment ID, genotype, treatment group, and acquisition date. Data export supports direct integration with R/Bioconductor pipelines (e.g., phenofit, hyperspec) and Python-based ML frameworks (scikit-learn, PyTorch). Audit logs record all user actions, parameter modifications, and algorithm versioning—meeting requirements for FDA 21 CFR Part 11 electronic record integrity when configured with role-based access control and digital signature modules.
Applications
- Quantitative trait locus (QTL) mapping and genome-wide association studies (GWAS) requiring high-resolution temporal phenotypic trajectories.
- Evaluation of transgenic or CRISPR-edited lines under controlled stress gradients (e.g., NaCl ramping, temperature step-changes).
- High-throughput screening of disease resistance phenotypes using texture- and reflectance-based classifiers trained on annotated lesion datasets.
- Phenological staging and growth vigor assessment across breeding nurseries using canopy development rate metrics.
- Calibration and validation of remote-sensing proxies (e.g., UAV-based NDVI) through ground-truthed, multi-angle spectral signatures.
- Ecophysiological studies linking stomatal conductance proxies (from thermal + NIR reflectance fusion) with environmental sensor networks.
FAQ
What environmental conditions are required for stable operation?
The system is rated for greenhouse use (15–35°C ambient, 30–80% RH non-condensing) and requires stable AC power (220 V ±10%, 50 Hz) and Ethernet connectivity. HVAC integration is recommended for thermal stability during hyperspectral acquisition.
Can the platform be extended to include thermal or fluorescence imaging?
Yes—mechanical and electrical interfaces support third-party FLIR or PSII-imaging modules; integration requires firmware update and calibration protocol alignment with Top Cloud-agri’s technical support team.
Is raw hyperspectral cube data accessible for custom spectral analysis?
Yes—full-resolution hypercubes (1920×1920×1200) are stored in ENVI-compatible format with radiometric and geometric metadata embedded per acquisition session.
How is system validation performed prior to deployment?
Each unit undergoes factory calibration using NIST-traceable reflectance standards (Labsphere Spectralon®), spatial resolution test charts (ISO 12233), and dimensional verification targets; a Certificate of Conformance and calibration report are supplied with delivery.
Does the system support integration with LIMS or ELN platforms?
Yes—via RESTful API endpoints and configurable JSON/XML webhooks; pre-built connectors exist for LabVantage, Benchling, and IDBS E-WorkBook upon request.
Related Products