Top Cloud-agri TP-GTL-S1 High-Throughput Abiotic Stress Simulation and Plant Growth Phenotyping Platform
| Brand | Top Cloud-agri |
|---|---|
| Origin | Zhejiang, China |
| Manufacturer Type | OEM/ODM Manufacturer |
| Country of Origin | China |
| Model | TP-GTL-S1 |
| Pricing | Upon Request |
Overview
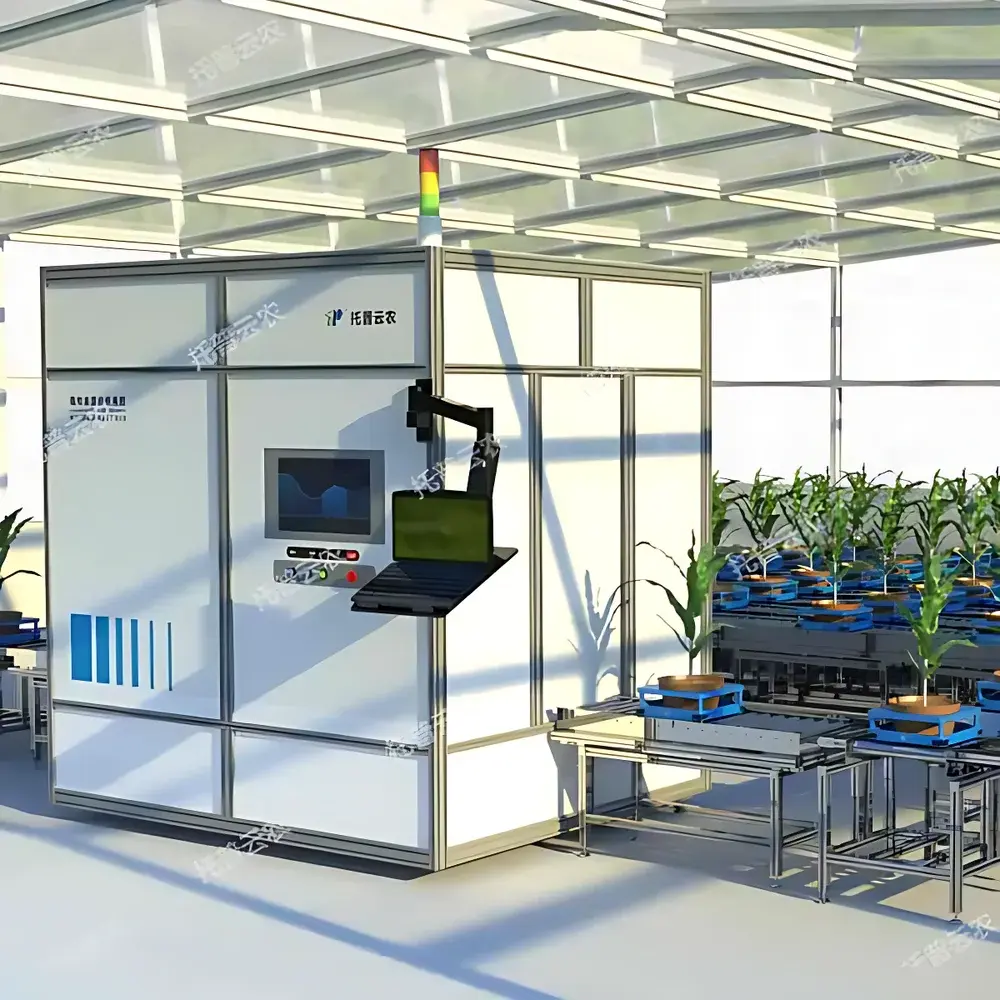
The Top Cloud-agri TP-GTL-S1 High-Throughput Abiotic Stress Simulation and Plant Growth Phenotyping Platform is an integrated, modular laboratory system engineered for controlled-environment plant phenomics. It combines precision environmental manipulation with multi-modal, non-destructive imaging and edge-based computational phenotyping to quantify dynamic physiological and morphological responses across the entire plant lifecycle. The platform operates on a closed-loop architecture: environmental parameters (soil moisture, salinity, pH, O₂, air temperature/humidity, CO₂) are continuously monitored and actively modulated to induce reproducible abiotic stress conditions—including drought, salinity, hypoxia, and nutrient imbalance—while synchronized imaging modules acquire structural, textural, spectral, and volumetric data at high temporal resolution. Designed for translational plant science, it supports hypothesis-driven research in functional genomics, quantitative trait locus (QTL) mapping, breeding program acceleration, and climate-resilience trait validation under GLP-aligned experimental workflows.
Key Features
- Modular, scalable architecture comprising five interoperable subsystems: Intelligent Cultivation Units, Automated Conveyor Transport System, Multi-Sensor Imaging Suite (RGB 2D, RGB-D 3D, and Hyperspectral), Edge AI Processing Unit, and Centralized Data Management Software.
- Real-time environmental control with ±0.5% RH accuracy, ±0.3°C air temperature stability, and soil sensor resolution down to 0.01 dS/m (EC), 0.01 pH unit, and 0.1% volumetric water content.
- Automated RFID-tagged plant tracking with sub-millimeter positioning repeatability; optional integrated load cell module (±0.1 g resolution) for longitudinal biomass monitoring.
- Integrated darkroom imaging chamber with customizable dimensions and standardized mounting interfaces for rapid module exchange and calibration traceability.
- Edge computing node running proprietary deep learning models optimized for plant-specific segmentation, 3D surface reconstruction (via structure-from-motion and multi-view stereo), and spectral unmixing—enabling on-device inference without cloud dependency.
- Fully compliant with FAIR data principles: all metadata (sensor calibration logs, illumination profiles, acquisition timestamps, environmental setpoints) are embedded in image headers and archived alongside raw and processed outputs.
Sample Compatibility & Compliance
The TP-GTL-S1 accommodates a broad range of model and crop species—from Arabidopsis thaliana and rice seedlings to maize, wheat, tomato, and lettuce—across growth stages from germination to reproductive maturity. Standard pot sizes range from 50 mL to 5 L volume; custom tray configurations support high-density screening (up to 240 plants per cycle). All imaging modules meet ISO 17025 traceable calibration protocols. Environmental control subsystems comply with ASTM E1826 (Standard Practice for Calibration of Environmental Chambers) and support audit-ready logging for GLP/GMP-regulated studies. Software architecture adheres to FDA 21 CFR Part 11 requirements for electronic records and signatures, including role-based access control, immutable audit trails, and user action logging.
Software & Data Management
The proprietary PhenomSuite™ software provides a unified interface for experiment design, acquisition scheduling, real-time dashboard visualization, and batch-level analytics. Users define experimental factors (e.g., stress onset time, intensity gradient, recovery duration) via ontology-driven templates aligned with MIAPPE (Minimum Information About a Plant Phenotyping Experiment) standards. Raw data—RGB images (5120×5120 pixels, 2.5 µm pixel pitch), hyperspectral cubes (1920×1920 spatial × 1200 spectral bands, 2.5 nm resolution, 400–1000 nm range), and time-series sensor logs—are stored in HDF5 format with embedded provenance metadata. Built-in analytical pipelines compute >30 vegetation indices (NDVI, GVI, PRI, MCARI, etc.), chlorophyll-a/b estimates (via inversion of PROSPECT-D), canopy nitrogen concentration (using partial least squares regression trained on ground-truthed Kjeldahl assays), and 3D-derived metrics (leaf area index, projected shoot volume, branch angle distribution). Export options include CSV, NetCDF, and MIAPPE-compliant ISA-Tab packages for integration with downstream statistical platforms (R, Python, SAS).
Applications
- Abiotic Stress Response Profiling: Quantification of drought-induced stomatal closure kinetics via thermal-RGB fusion; salinity tolerance assessment through real-time Na⁺/K⁺ ratio proxy modeling using hyperspectral band ratios (e.g., 550 nm / 710 nm).
- Mutant Screening & QTL Validation: High-throughput discrimination of morphological mutants (e.g., dwarfism, altered leaf angle, reduced tillering) using 3D crown architecture descriptors and texture-based health scoring.
- Nutrient Use Efficiency (NUE) Analysis: Dynamic mapping of nitrogen redistribution during senescence using time-lapse chlorophyll degradation curves derived from hyperspectral time series.
- Disease Progression Monitoring: Early detection of biotrophic pathogen infection (e.g., powdery mildew, rust) via subtle shifts in red-edge reflectance and fluorescence lifetime proxies prior to visible symptom onset.
- Cultivar Performance Benchmarking: Multi-location trial harmonization using environmental covariate normalization and cross-platform phenotype standardization (e.g., PHECOS framework).
FAQ
What environmental stressors can be precisely simulated?
Drought (via programmable soil moisture depletion), salinity (NaCl or CaCl₂ dosing with EC feedback), hypoxia (N₂/CO₂ gas mixing), elevated CO₂ (400–2000 ppm), and nutrient deficiency/excess (NPK titration with conductivity-pH coupling).
Is the system compatible with existing greenhouse or growth chamber infrastructure?
Yes—the platform operates as a standalone unit but supports integration with third-party HVAC, irrigation, and lighting systems via Modbus TCP, BACnet/IP, or OPC UA protocols.
How is data integrity ensured during long-term experiments?
All sensors undergo automated daily self-calibration checks; imaging modules include NIST-traceable reference targets; software enforces checksum validation and version-controlled pipeline execution logs.
Can custom machine learning models be deployed on the edge unit?
Yes—PhenomSuite™ supports ONNX-compatible model ingestion and GPU-accelerated inference on the onboard NVIDIA Jetson AGX Orin module.
What level of technical support and training is provided?
Includes on-site installation commissioning, 5-day operator certification workshop, annual algorithm update subscriptions, and remote diagnostics with SLA-governed response times.


