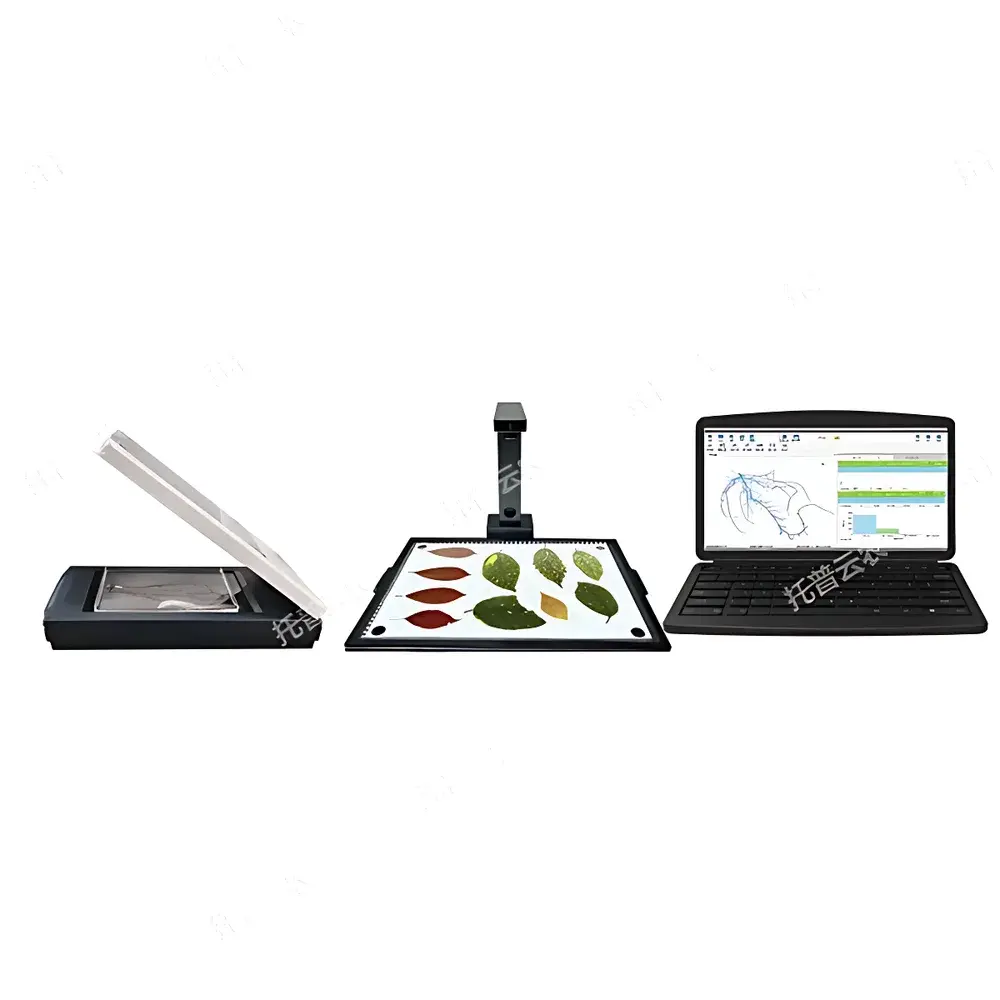
Top Cloud-agri TP-PAS-1 Plant Root and Leaf Area Image Analysis System
| Brand | Top Cloud-agri |
|---|---|
| Origin | Zhejiang, China |
| Manufacturer Type | Direct Manufacturer |
| Model | TP-PAS-1 |
| Pricing | Upon Request |
Overview
The Top Cloud-agri TP-PAS-1 Plant Root and Leaf Area Image Analysis System is a dedicated digital phenotyping platform engineered for high-throughput, non-destructive morphometric analysis of excised plant organs. Built upon robust computer vision algorithms and calibrated image acquisition hardware, the system implements pixel-based segmentation, edge detection, and topological graph reconstruction to quantify structural and chromatic features of roots and leaves. It operates on the principle of 2D planar image analysis—requiring flat, evenly illuminated, high-contrast digitized specimens (scanned or high-resolution captured)—and delivers reproducible, operator-independent measurements essential for quantitative plant physiology, breeding trials, stress response studies, and ecological trait screening. The system supports both static offline analysis and cloud-synchronized data workflows, aligning with modern requirements for traceable, auditable, and scalable phenotypic data generation in academic, agricultural R&D, and regulatory-compliant environments.
Key Features
- Integrated dual-input imaging: Supports both high-resolution flatbed scanning (for root systems and intact leaves) and overhead high-speed capture via calibrated USB high-frame-rate camera module—enabling flexible adaptation to sample size, fragility, and throughput needs.
- Automated topology-aware root architecture analysis: Constructs hierarchical root graphs from segmented binary masks; identifies primary root, lateral branches, root tips, forks, and overlaps using graph-theoretic traversal—preserving spatial connectivity for accurate branching order assignment and length summation per hierarchy level.
- Chromatically adaptive lesion and damage quantification: Leverages HSV color space thresholding combined with morphological filtering to isolate necrotic spots, insect feeding zones, and missing tissue regions—calculating absolute area, relative coverage (% of total leaf area), perimeter, and spatial distribution metrics.
- Royal Horticultural Society (RHS) Colour Chart integration: Embedded reference palette enables standardized color classification of leaf and root tissues—mapping RGB values to RHS codes with ΔEab < 3.0 tolerance—supporting consistent phenotypic documentation across multi-site trials and longitudinal monitoring.
- Batch processing engine: Processes ≥100 images consecutively with user-defined parameter presets; auto-generates annotated TIFF/PNG outputs alongside CSV/Excel reports—including metadata timestamps, operator ID, and instrument calibration log tags.
- Region-of-interest (ROI) masking: Enables selective analysis of sub-regions—e.g., distal root zones, leaf lamina margins, or individual compound leaflets—without full-sample segmentation interference.
- Parametric binning & sorting: Automatically groups roots or leaves by user-selected metrics (e.g., length, diameter, area, color code) into customizable bins—facilitating statistical stratification and trait correlation modeling.
- Interactive manual correction suite: Includes spline-based line repair, junction splitting/merging, tip repositioning, color-based region reclassification, and polygonal cropping—ensuring analytical fidelity where automatic segmentation fails due to overlapping or low-contrast specimens.
Sample Compatibility & Compliance
The TP-PAS-1 accommodates a broad spectrum of dicot and monocot species—including Arabidopsis, rice, maize, wheat, soybean, tomato, and woody seedlings—provided specimens are cleanly washed, flattened, and imaged under standardized lighting (CIE D65 illuminant, uniform backlight or diffuse top-light). Root samples must be fully extended without folding; leaf samples should be free of overlapping layers or surface moisture. The system complies with ISO 22867:2021 (Plant Phenotyping — Imaging Requirements for Morphometric Analysis) and supports GLP-aligned data integrity through embedded audit trails: all corrections, parameter changes, and export actions are time-stamped and logged. Raw image files retain EXIF metadata; processed results include hash-verified checksums. While not FDA 21 CFR Part 11-certified out-of-the-box, the software architecture permits integration with validated LIMS environments via RESTful API endpoints and encrypted SFTP upload protocols.
Software & Data Management
The proprietary TP-PAS Software Suite (v4.2+) runs on Windows 10/11 (64-bit) and includes modular analysis modules: RootTopo, LeafMorph, ColorMatch, and LesionQuant. All modules operate within a unified project workspace supporting versioned experiment templates, multi-user role permissions (admin/operator/analyst), and configurable export profiles. Analytical outputs are exportable in native .tpas project format, comma-separated values (.csv), Microsoft Excel (.xlsx), and encrypted ZIP archives (AES-256). Cloud synchronization is implemented via TLS 1.3–secured HTTPS push to Top Cloud-agri’s ISO 27001–certified data center; uploaded datasets retain immutable provenance chains and support cross-project comparative analytics dashboards. Audit logs record every analysis session—including original image hash, applied filters, manual edits, and final parameter values—meeting minimum ALCOA+ (Attributable, Legible, Contemporaneous, Original, Accurate, Complete, Consistent, Enduring, Available) criteria for research-grade data governance.
Applications
- Root system architecture (RSA) phenotyping in drought-tolerance and nutrient-use-efficiency screening programs.
- Leaf area index (LAI) derivation and allometric scaling for canopy modeling and photosynthetic capacity estimation.
- Quantitative assessment of biotic stress symptoms—e.g., fungal lesion progression in wheat septoria trials or aphid-induced chlorosis in Brassica spp.
- Post-harvest quality evaluation of horticultural crops—measuring leaf discoloration, edge burn, or mechanical damage in lettuce, spinach, or ornamental foliage.
- Educational use in plant morphology labs: visualizing root branching patterns, leaf shape variation (ellipticity, lobation), and ontogenetic color shifts during senescence.
- Regulatory submission support: generating measurement traceability packages compliant with OECD Test Guideline 208 (Terrestrial Plant Test) and EPPO PM 7/109 (Phytosanitary Risk Assessment).
FAQ
What specimen preparation protocols are recommended for optimal root analysis?
Roots must be thoroughly rinsed to remove soil particles, gently blotted dry, and arranged flat on a white background with minimal overlap. Scanning resolution should be set to ≥600 dpi; grayscale mode is preferred over color unless color-based segmentation is required.
Can the system analyze live, unexcised roots in hydroponic or gel media?
No—the TP-PAS-1 is designed exclusively for ex situ 2D planar imaging. In vivo root imaging requires complementary modalities such as rhizotron imaging, MRI, or X-ray microtomography.
Is calibration verification supported?
Yes: the software includes a built-in calibration wizard that validates pixel-to-mm conversion using certified stage micrometer images; calibration status is embedded in every exported report.
How does the system handle overlapping root segments or fused leaf veins?
It applies skeletonization followed by branch-point detection and iterative thinning; users may manually intervene via the “Split Junction” tool to resolve ambiguous connections before topology reconstruction.
Are software updates and technical support included post-purchase?
Standard warranty includes 12 months of remote technical support and free minor-version software updates; major-version upgrades and on-site training are available under optional service agreements.