Top Cloud-agri TP-plant-HIPS High-Spectral Plant Phenotyping Imaging System
| Brand | Top Cloud-agri |
|---|---|
| Origin | Zhejiang, China |
| Manufacturer Type | Direct Manufacturer |
| Country of Origin | China |
| Model | TP-plant-HIPS |
| Price Range | USD 1,780 – 5,490 (FOB) |
| Spectral Range | 400–1000 nm |
| Spectral Bands | ≥1200 |
| Imaging Configuration | Top-mounted push-broom hyperspectral imager with motorized vertical stage |
| Acquisition Time | ≤40 s per potted plant |
| Analysis Time | ≤30 s per plant |
| Power Consumption | <1 kW (typical 500 W) |
| Enclosure Dimensions | 1400 × 935 × 1840 mm (L×W×H) |
| Light Source | Low-flicker, high-CRI halogen illumination |
| Output | Reflectance-corrected hyperspectral cubes, vegetation index maps, biochemical parameter distribution images (chlorophyll, nitrogen), ROI-based spectral curves |
Overview
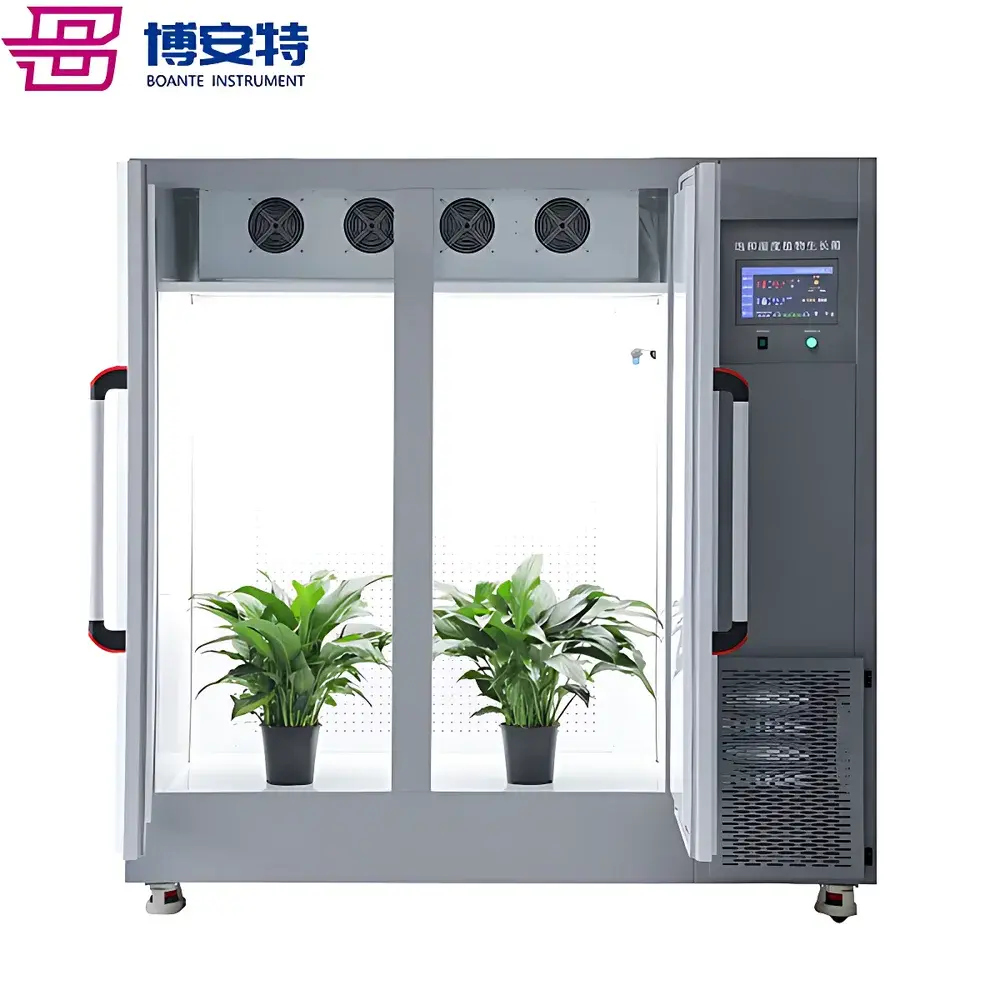
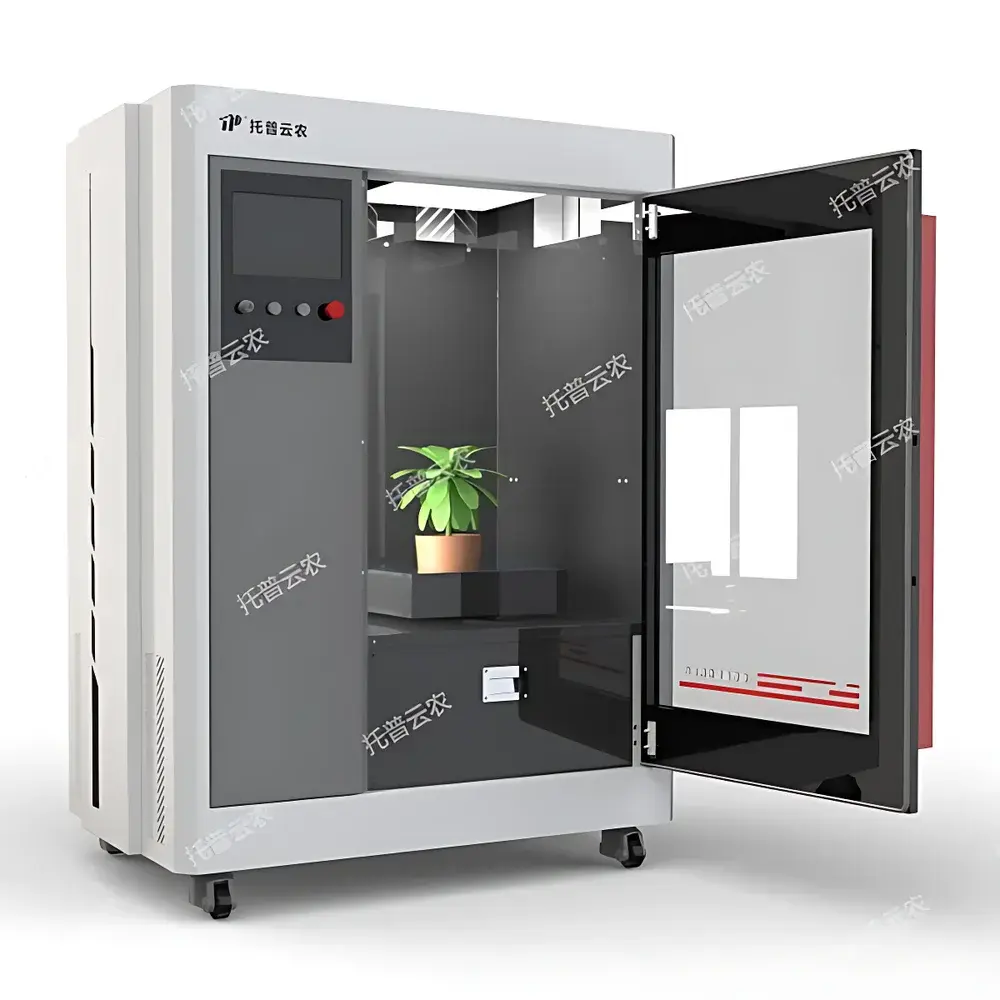
The Top Cloud-agri TP-plant-HIPS High-Spectral Plant Phenotyping Imaging System is a benchtop, top-view hyperspectral imaging platform engineered for non-destructive, quantitative phenotypic characterization of potted plants under controlled conditions. It operates on the principle of push-broom hyperspectral imaging—capturing spatially resolved reflectance spectra across 1200+ narrow bands from 400 to 1000 nm—to generate three-dimensional data cubes (x, y, λ). These cubes serve as the foundation for extracting biophysically meaningful traits including chlorophyll concentration, canopy nitrogen content, water band index (WBI), normalized difference vegetation index (NDVI), red-edge chlorophyll index (CCCI), and nitrogen reflectance index (NRI). Unlike RGB or multispectral systems, the TP-plant-HIPS resolves subtle spectral shifts associated with early-stage physiological stress, nutrient deficiency, or pathogen infection—enabling detection prior to visible symptom onset. Its design targets reproducible acquisition in greenhouse, growth chamber, or core facility environments, supporting longitudinal monitoring and genotype-by-environment (G×E) studies.
Key Features
- Top-mounted hyperspectral imager: Fixed-position push-broom sensor with integrated motorized vertical stage ensures consistent working distance and illumination geometry across varying plant heights (up to 1.2 m).
- High-fidelity illumination: Low-flicker, high-color-rendering-index (CRI >95) halogen source provides stable, spectrally uniform irradiance—critical for radiometric calibration and inter-session comparability.
- Sub-minute workflow: Full acquisition and on-device spectral reconstruction completed in ≤40 s per plant; quantitative trait mapping and index computation finalized in ≤30 s—enabling throughput of >60 samples per hour.
- Integrated sample traceability: QR-code scanning links raw hyperspectral data to experimental metadata (genotype, treatment, timepoint), ensuring audit-ready provenance for GLP-compliant trials.
- Touch-enabled control interface: 10.1-inch capacitive display supports real-time preview, lighting intensity adjustment, stage positioning, and immediate visual feedback during acquisition.
- Modular enclosure design: Self-contained, wheeled chassis (1400 × 935 × 1840 mm) permits flexible deployment in shared labs without permanent infrastructure—no external darkroom or vibration isolation required.
Sample Compatibility & Compliance
The TP-plant-HIPS is validated for potted specimens up to 30 cm in diameter and 120 cm in height—including monocots (e.g., rice, maize), dicots (e.g., tomato, Arabidopsis, soybean), and rosette-forming species. Sample handling requires no contact, clipping, or labeling beyond standard pot identification. The system adheres to ISO/IEC 17025 principles for measurement traceability: spectral calibration performed using NIST-traceable reflectance standards (e.g., Spectralon®), and radiometric stability monitored via built-in reference panel. While not certified to FDA 21 CFR Part 11, its software architecture supports ALCOA+ data integrity attributes—including electronic signatures, audit trails, and immutable raw data storage—making it suitable for pre-regulatory agricultural research aligned with OECD GLP guidelines.
Software & Data Management
Bundled HIPS-Analyze™ software provides an integrated environment for preprocessing (dark current subtraction, flat-field correction, geometric rectification), spectral analysis (ROI selection, curve extraction, derivative spectroscopy), and trait modeling. It includes pre-validated, physics-informed inversion models for leaf chlorophyll (SPAD-equivalent) and canopy nitrogen (g·m⁻²), derived from peer-reviewed regression frameworks published in Remote Sensing of Environment and Plant Methods. Users may export ENVI-compatible .hdr/.bil files, GeoTIFF vegetation index rasters, CSV spectral libraries, and PNG overlays for publication. Custom model development is supported via Python API integration—allowing users to train supervised classifiers (e.g., SVM, Random Forest) on spectral signatures of disease lesions or drought-induced senescence. All processed outputs retain embedded EXIF-like metadata (wavelength grid, exposure time, lamp voltage, stage height) to ensure full experimental reproducibility.
Applications
- Mutation screening: High-throughput discrimination of chlorophyll-deficient or nitrogen-use-efficient mutants based on spectral divergence in red-edge (680–750 nm) and near-infrared (750–1000 nm) regions.
- Abiotic stress phenotyping: Quantification of osmotic adjustment (via WBI), photosynthetic inhibition (via NDVI decline rate), and oxidative damage (via anthocyanin index) under salinity, drought, heat, or cold treatments.
- Pathogen-host interaction studies: Spatial mapping of lesion boundaries and spectral decay gradients—enabling early diagnosis of fungal (e.g., Phytophthora) or bacterial infections before necrosis spreads.
- Fertilizer response trials: Temporal tracking of nitrogen assimilation efficiency across genotypes using dynamic CCCI trajectories, supporting breeding for reduced-input agriculture.
- Canopy architecture analysis: Derivation of fractional cover, LAI proxies, and light interception metrics from multi-angle reflectance composites (when combined with optional turntable accessory).
FAQ
What spectral resolution does the TP-plant-HIPS achieve?
The system delivers contiguous sampling at ~0.5 nm bandwidth across 400–1000 nm, resulting in effective spectral resolution sufficient to resolve key absorption features (e.g., chlorophyll-a at 680 nm, water at 970 nm).
Can it be used for field-grown plants?
No—it is designed exclusively for controlled-environment potted plants. Field deployment would require ruggedized optics, GPS synchronization, and atmospheric correction—capabilities outside this platform’s scope.
Is spectral calibration required before each session?
A daily white-reference acquisition is recommended; factory-installed calibration coefficients remain valid for ≥12 months under stable lab conditions per ISO 12232 Annex D protocols.
Does the software support batch processing of time-series data?
Yes—HIPS-Analyze™ includes a scriptable pipeline mode enabling automated processing of multi-day experiments with consistent ROI placement and model application.
What file formats are supported for third-party analysis?
Raw data exports as ENVI BIL, HDF5, and TIFF stacks; processed indices and maps export as GeoTIFF or PNG with embedded georeferencing metadata.