Top Cloud-agri TP-plant-HIPS High-Spectral Plant Phenotyping Imaging System
| Brand | Top Cloud-agri |
|---|---|
| Origin | Zhejiang, China |
| Manufacturer Type | OEM Manufacturer |
| Country of Origin | China |
| Model | TP-plant-HIPS (Hyperspectral) |
| Pricing | Upon Request |
| Spectral Range | 400–1000 nm |
| Spectral Bands | ≥1200 |
| Imaging Configuration | Top-down Hyperspectral Scanning |
| Sample Handling | Potted Plants |
| Acquisition Time | 40 s per plant |
| Analysis Time | 30 s per plant |
| Power Consumption | <1 kW |
| Enclosure Dimensions | 1400 × 935 × 1840 mm (L×W×H) |
| Light Source | Low-flicker, High-CRI Halogen Illumination |
| Output Maps | Chlorophyll Distribution, Nitrogen Content, NDVI, GVI, WBI, CCCI, NRI |
Overview
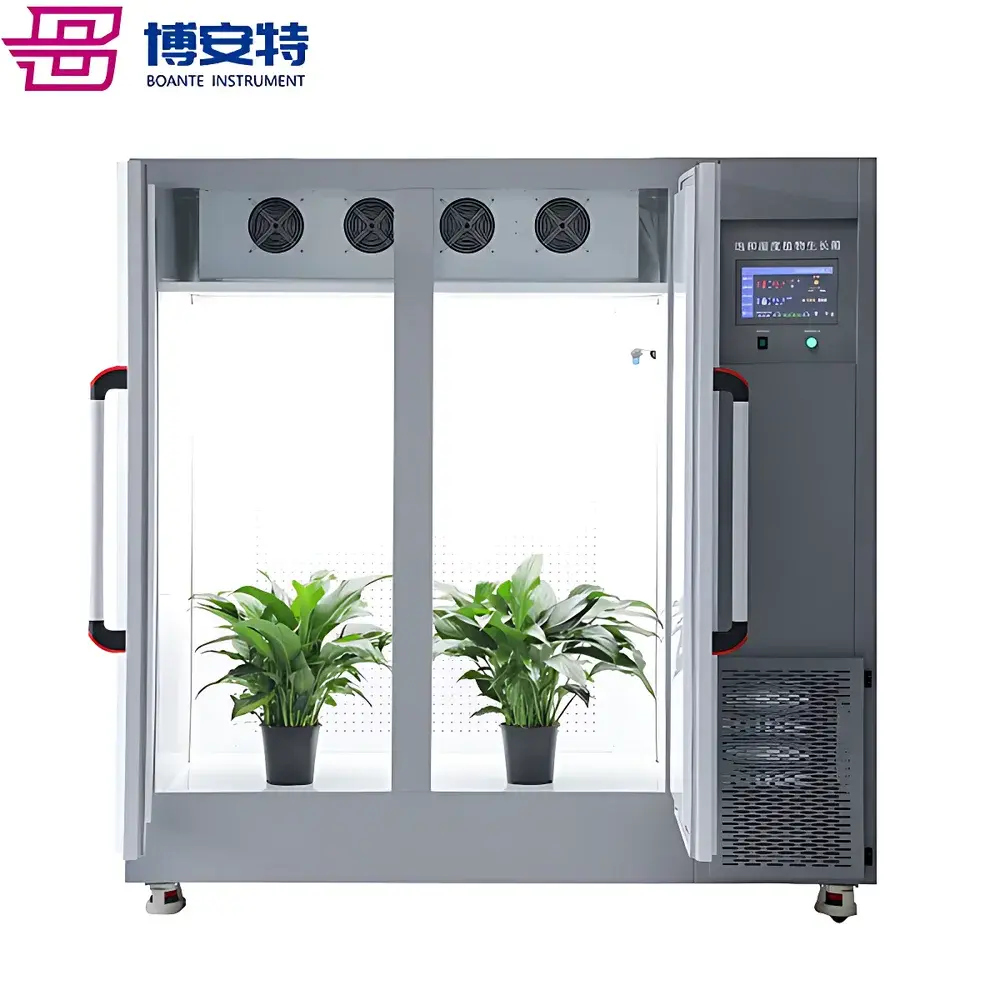
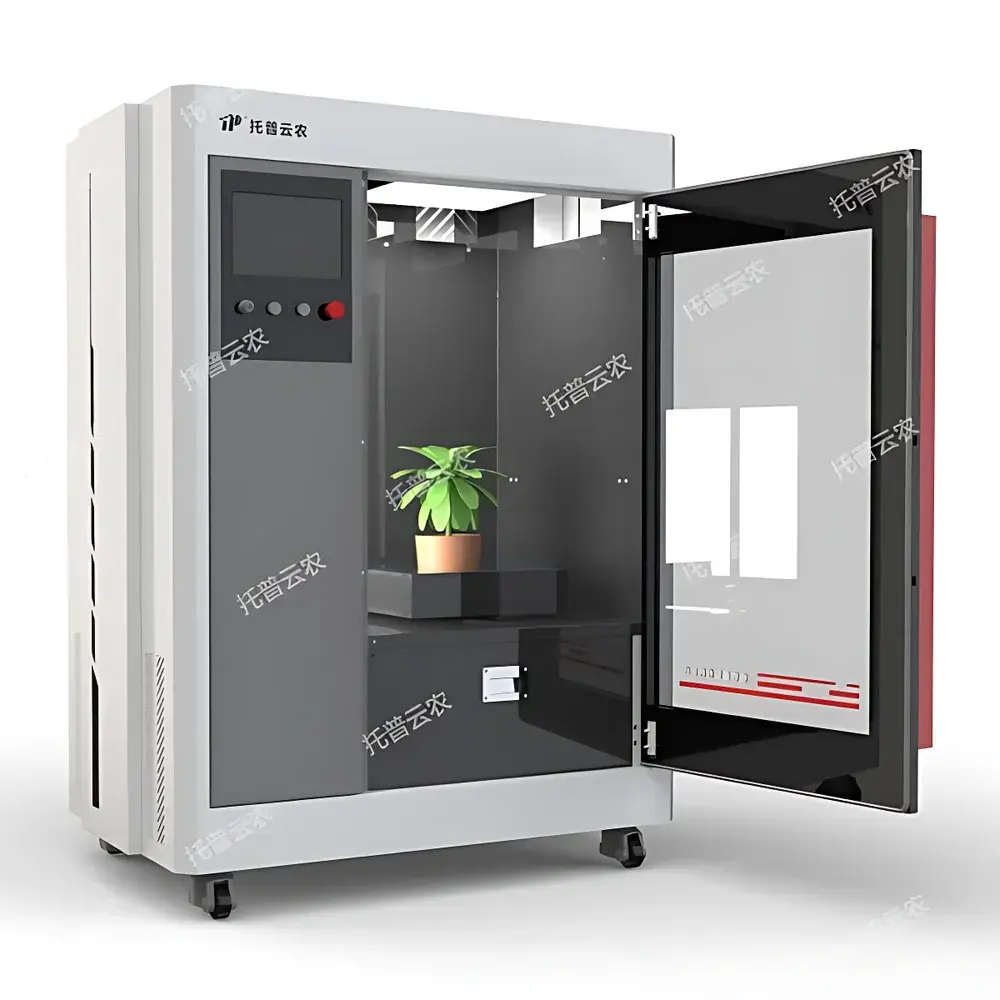
The Top Cloud-agri TP-plant-HIPS is a laboratory-grade, top-view hyperspectral imaging platform engineered for non-destructive, high-throughput plant phenotyping. It operates on the principle of push-broom or snapshot hyperspectral imaging—capturing contiguous spectral bands across the visible to near-infrared (VNIR) range (400–1000 nm) with spectral resolution sufficient to resolve narrow absorption features associated with photosynthetic pigments, water content, nitrogen status, and structural biomarkers. Unlike RGB or multispectral systems, the TP-plant-HIPS acquires >1200 spectral bands per pixel, enabling pixel-wise spectral unmixing and quantitative biophysical parameter retrieval. Its integrated motorized vertical stage ensures consistent working distance and illumination geometry across variable plant heights—critical for reproducible reflectance calibration and inter-experiment comparability. Designed for controlled-environment labs and greenhouse core facilities, the system supports standardized acquisition protocols aligned with FAO’s Crop Ontology and MIAPPE (Minimum Information About a Plant Phenotyping Experiment) metadata guidelines.
Key Features
- Top-down hyperspectral scanning architecture with automated z-axis positioning for repeatable imaging geometry across potted plants (up to 1.2 m height)
- Low-flicker, high-color-rendering-index (CRI >95) halogen illumination optimized for stable radiometric response under continuous acquisition
- Real-time spectral cube generation (ENVI-compatible .hdr/.raw format) with on-device preview of reflectance-corrected data
- Integrated barcode/QR code sample tracking—linking physical specimens to spectral datasets, experimental metadata, and analysis logs
- Touch-enabled industrial HMI interface with contextual controls for lighting intensity, stage height, exposure time, and ROI pre-selection
- Modular software architecture supporting both out-of-the-box vegetation index computation and user-defined spectral modeling workflows
- Self-contained enclosure (1400 × 935 × 1840 mm) with casters and lockable leveling feet—designed for flexible deployment in shared lab spaces without infrastructure modification
Sample Compatibility & Compliance
The TP-plant-HIPS accommodates standard growth containers (e.g., 10–20 cm pots), seedling trays, and small-scale hydroponic units. It has been validated for dicot and monocot species including Arabidopsis thaliana, rice (Oryza sativa), tomato (Solanum lycopersicum), maize (Zea mays), and soybean (Glycine max). All spectral calibrations are traceable to NIST-traceable reflectance standards (e.g., Spectralon® 99% white reference). Data acquisition complies with ISO 17025 principles for measurement uncertainty management, and raw spectral files include embedded EXIF-like metadata (timestamp, lamp voltage, integration time, stage position) to support GLP/GMP-aligned audit trails. While not FDA 21 CFR Part 11 certified out-of-the-box, the software architecture permits integration with validated LIMS environments requiring electronic signature and change control functionality.
Software & Data Management
The proprietary Phenolyze™ software suite provides a unified workflow from acquisition to interpretation. Core modules include: (1) Real-time spectral cube reconstruction with dark-current and flat-field correction; (2) Interactive ROI definition with polygon, rectangle, and mask-based segmentation; (3) Batch processing engine supporting parallelized vegetation index calculation (NDVI, RVI, GVI, WBI, CCCI, NRI); (4) Built-in empirical inversion models for chlorophyll-a concentration (µg/cm²), canopy nitrogen content (g/m²), and water band index (WBI)-derived relative water content; (5) Python API access for custom model deployment (e.g., PLSR, RF, CNN-based regression) using exported spectral libraries; (6) MIAPPE-compliant export options (CSV, NetCDF, HDF5) with ontology-tagged variables. All processing steps are logged with timestamps and operator IDs, fulfilling traceability requirements for peer-reviewed publication and regulatory submission.
Applications
The TP-plant-HIPS serves as a primary phenotyping tool in forward and reverse genetics pipelines—enabling rapid screening of mutagenized or CRISPR-edited lines for subtle physiological deviations undetectable by visual scoring. In abiotic stress physiology, it quantifies spatiotemporal dynamics of photochemical efficiency (via red-edge inflection point shifts), stomatal conductance proxies (via NIR water absorption features), and osmotic adjustment markers (via cellulose/lignin spectral ratios). For biotic stress research, it differentiates early-stage fungal infection (e.g., Botrytis cinerea) from abiotic chlorosis by analyzing spectral divergence in the 500–600 nm region prior to symptom visibility. Applications extend to breeding programs evaluating nutrient-use efficiency (NUE), drought resilience indices, and canopy architecture traits such as leaf angle distribution (via multi-angle reflectance modeling) and tillering density (via spatial autocorrelation of spectral texture).
FAQ
What spectral calibration standards are supported?
The system includes factory calibration against Spectralon® 99% and 2% reflectance standards; users may perform field recalibration using supplied portable references.
Can the system be integrated with existing greenhouse automation platforms?
Yes—via Modbus TCP and RESTful API interfaces, enabling synchronization with environmental controllers, irrigation systems, and robotic transport modules.
Is spectral data export compatible with ENVI, ArcGIS, or R environments?
All spectral cubes are saved in ENVI BIL format with full header metadata; R packages (hyperSpec, speccy) and Python libraries (scikit-image, h5py) are natively supported.
Does the system support time-series phenotyping across developmental stages?
Yes—the stage positioning repeatability (±0.1 mm) and auto-alignment algorithm ensure sub-pixel registration across sequential scans for longitudinal trait tracking.
What level of technical support and software updates are provided post-purchase?
Top Cloud-agri offers 24-month hardware warranty, remote diagnostics, annual software maintenance including algorithm updates and new vegetation index modules, and on-site application training upon request.